Fig. 4.
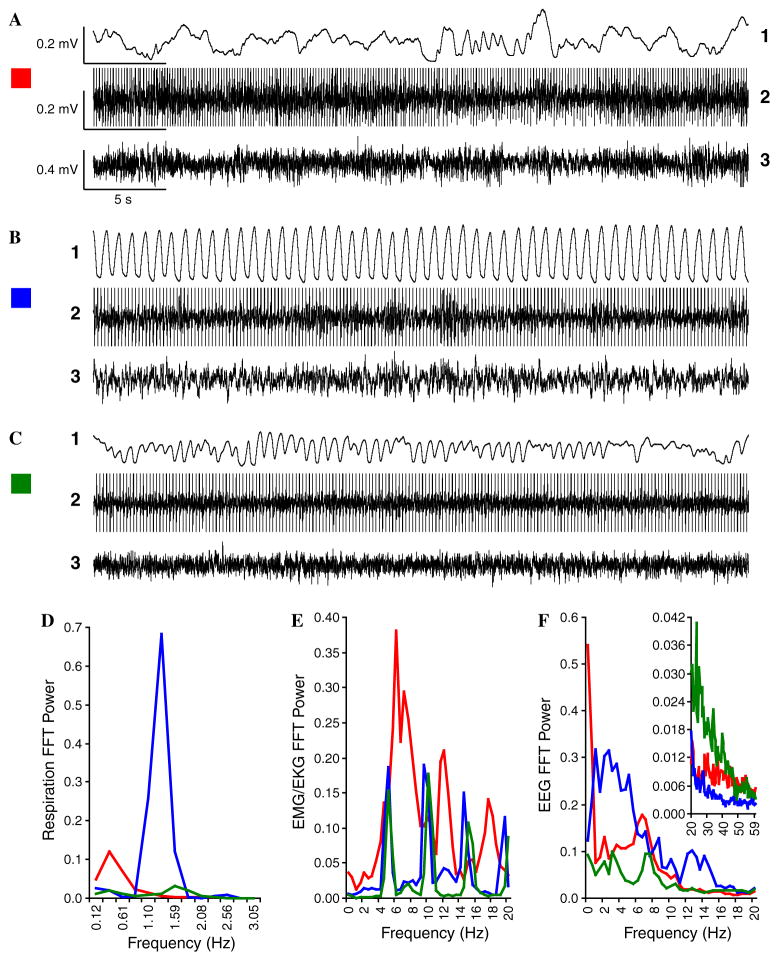
Animal states. Examples of different states as defined by respiration pattern (1), EKG/EMG activity (2), and EEG (3). [EKG activity has high amplification (therefore “amplitude clipped”) to permit visualization of intermixed EMG activity.] (A) Active exploratory and grooming behavior (video-monitoring) were accompanied by irregular respiration that was mostly high amplitude, low frequency (A1), irregular heart rate and high amplitude EMG activity (A2), and EEG with prominent very slow delta (<2 Hz) waves and marked theta waves (A3). (B) Calm wakefulness, evidenced by opened-eyed motionless supine posture was accompanied by highly regular high amplitude respiration (B1), with generally lower and more regular EMG/EKG activity (B2), and irregular, although mostly lower frequency (1–8 Hz), often higher amplitude EEG rhythms (B3). (C) Paradoxical (REM) sleep (closed-eyes, motionless with occasional twitches) was characterized by low amplitude, shallow mixed regular–irregular respiration (C1), lowest amplitude EMG and somewhat regular EKG (C2) and lowest amplitude EEG with reduced slow waves (delta, theta, and alpha) and the highest level of high frequency waves (C3). (D–F) Spectral analyses of respiration, EMG/EKG and EEG, respectively, for each of the three states (red = exploration, blue = quiet waking, green = paradoxical sleep). (D) Respiration power was maximal at the lower end of frequency range (0.37 Hz) during exploration/grooming (red), at both lower (0.37 Hz) and higher (1.59 Hz) frequencies during paradoxical sleep (green), and by far largest and most consistent in the middle (1.35 Hz) of the range during calm wakefulness (blue). Such clear differences make respiration a particularly useful indicator for each state. (E) The peaks of the histograms represent heartbeats carrying maximal power. EMG/EKG power was similar between the calm and paradoxical states. Also, heart rate during exploration was less regular as indicated by broader peaks in the frequency spectrum. (F) The EEG spectrum during exploration had high power at the lowest frequencies with clear theta power (6–8 Hz) and moderate high frequency power (inset). Calm waking had prominent low frequency (up to 20 Hz) power with the lowest level of higher frequencies (inset), while paradoxical sleep had the lowest low frequency power but much the largest high frequencies; exploration had very high power at the lowest EEG frequencies but otherwise an intermediate profile for other frequencies. All stimuli were presented during baseline (pre-training), training and post-training periods when respiration was most regular (B1).

