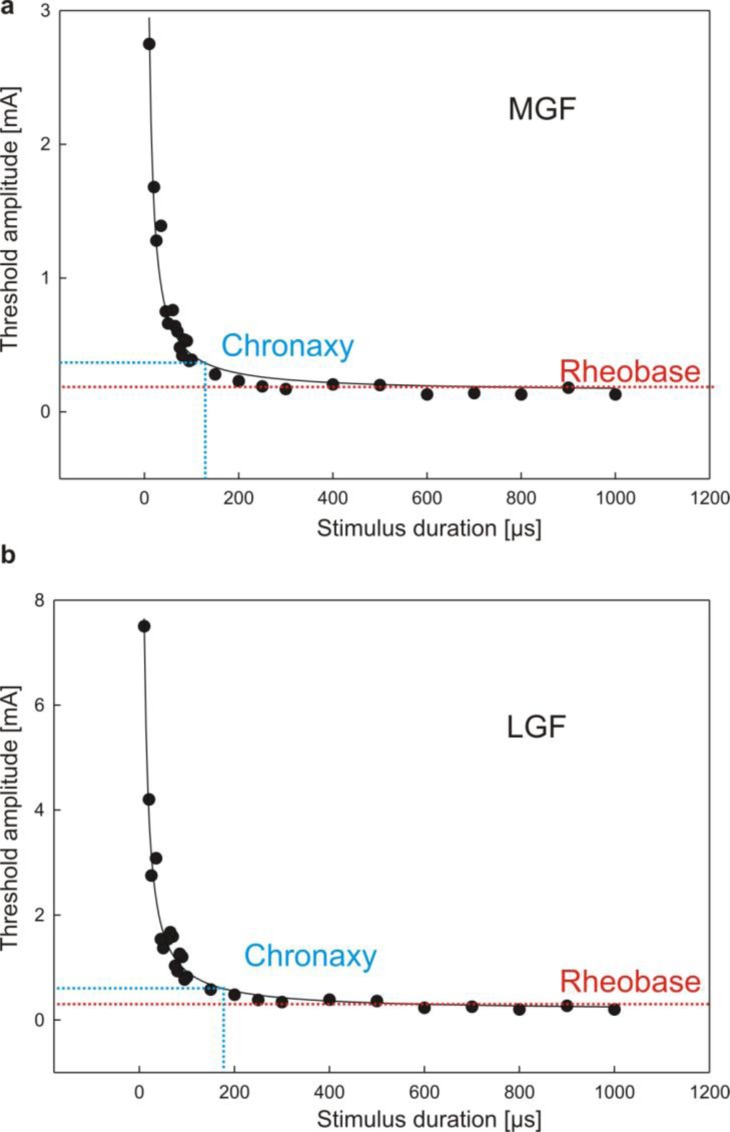
Figure 7.
Strength-duration curves. (a) Representative student measurements of the MGF strength-duration curve. In this example, we used 24 different stimulus durations and amplitudes up to 2.8 mA. The minimal electric current (rheobase) of the MGF is at 0.19 mA and the chronaxy is at 129 μs. (b) The strength-duration curve of the LGF shows a rheobase of 0.3 mA and a chronaxy of 177 μs.

