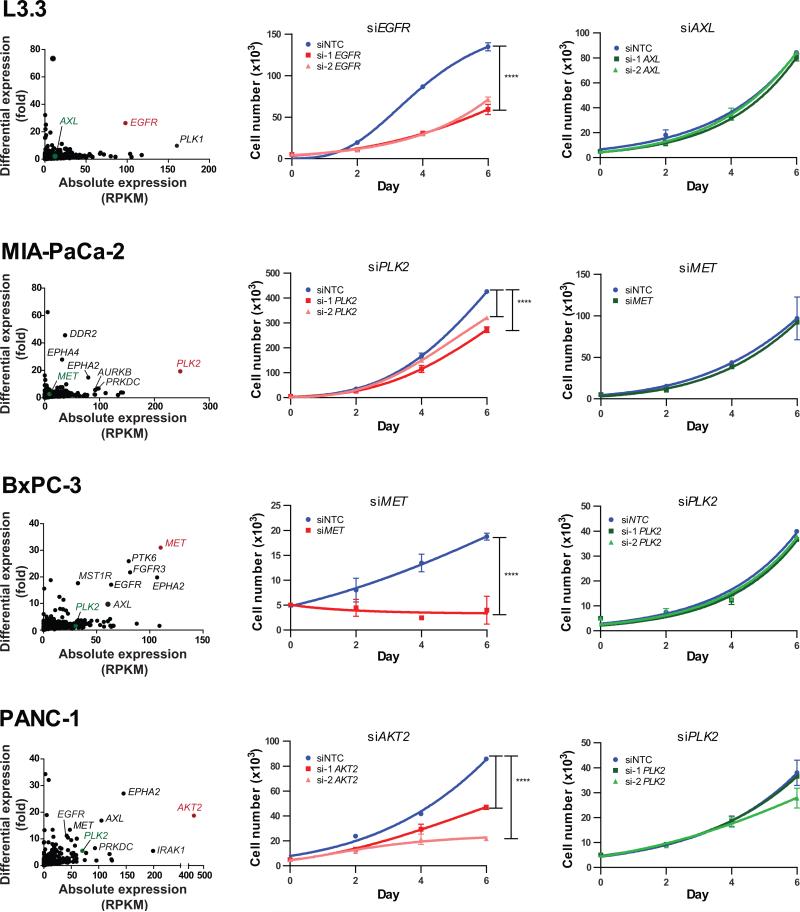
Figure 5. Pancreatic cancer cell lines are sensitive to knockdown of outlier kinases.
(Left) Scatter plots display kinome profiles of select pancreatic cancer cell lines; kinases targeted for knockdown are shown in color (red, outliers; green, non-outliers). Labels in black denote additional kinases with outlier expression. The growth curves display the effects of siRNA-mediated knockdown of sample-specific outliers (middle) and non-outliers (right) for each cell line. Values represent mean ± SD. ****, P < 0.0001.

