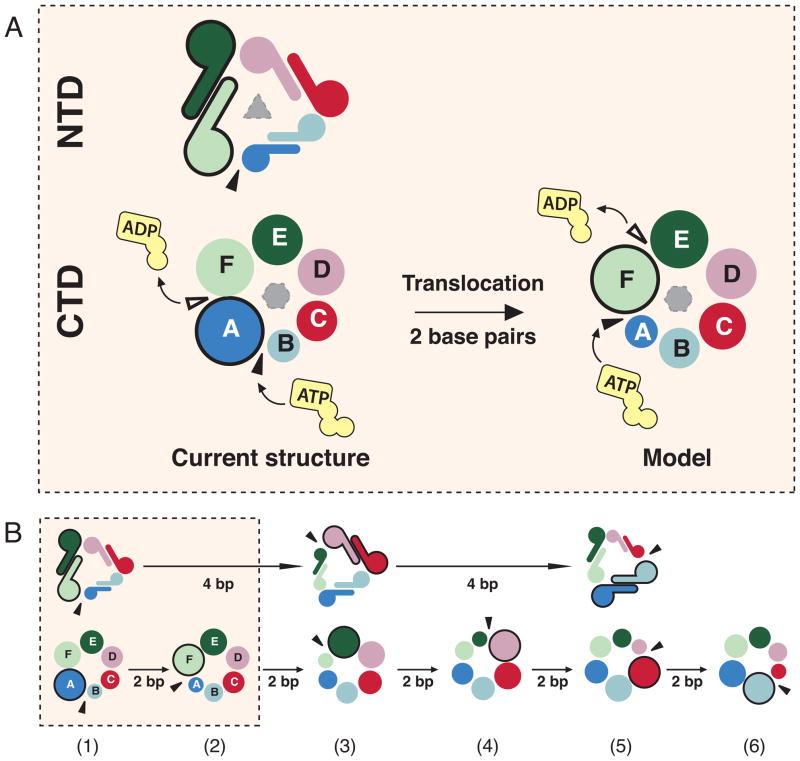
Figure 5. Synchronization of the NTD staircase formation with the NTP hydrolysis cycle in the CTD staircase.
A) Top view down the 5′ end of the ssDNA substrate. The NTD (top) and CTD (bottom) staircases are shown as dimers and circles that are spiraling into the plane of the paper, respectively. The sizes of the subunits indicate the positions of the subunits along the spiral staircase with the largest symbols representing the top subunits and the smallest symbols representing the bottom subunits. Black triangles denote sites where the NTD and CTD staircases split into the lockwasher. In the CTD panel, the black triangles also illustrate the binding site of incoming NTP while white triangles indicate the site of NTP hydrolysis.
B) The NTD trimer-of-dimers would act as a 3-step staircase that splits after the translocation over 4 base pairs whereas the CTD staircase splits after two basepairs. State 1 is the current structure, while states 3 and 5 are generated by 120° and 240° clockwise rotation of state 1 along the ssDNA axis. See also Movie S2

