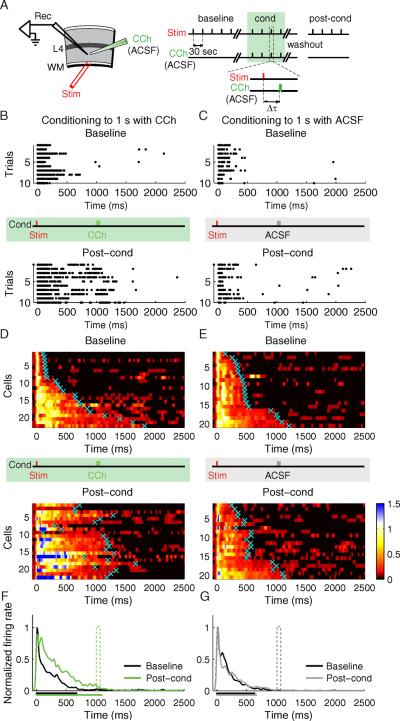
Fig. 4.
Response Duration Plasticity. A) Experimental design (Rec, recording electrode; Stim, stimulating electrode; WM, white matter; L4, layer 4; CCh, carbachol; ACSF, artificial cerebrospinal fluid). Conditioning (cond) is performed by CCh application at Δt delay after electrical stimulation. B–C) Raster plots of representative neurons before (baseline) and after (post-cond) conditioning. B) A neuron conditioned with CCh applied at 1s delay. C) A control neuron conditioned with ACSF applied at 1s delay. The vertical red tick indicates the time of electrical stimulus, the vertical green and gray ticks indicate the time corresponding to the CCh- or ACSF- application during conditioning, correspondingly. D–E) SDFs of the neurons before (baseline) and after (post-cond) CCh conditioning (D; n = 22 neurons from 8 animals), or, ACSF conditioning (E; n = 20 from 6 animals). For visualization, the color scale shows spike densities greater than 1 standard deviation above spontaneous, normalized to the peak response magnitude during the baseline period. Cyan crosses represent neurons' calculated response durations (time to return to 1 STD of a neuron's spontaneous firing rate). Individual neuronal responses are sorted according to the baseline response durations. F) Population SDFs before (black) and after (green) CCh conditioning. G) Population SDFs before (black) and after (gray) control ACSF conditioning. The mean neuronal response duration before and after conditioning is shown as the corresponding colored bars below the x axis. See also Figure S3.

