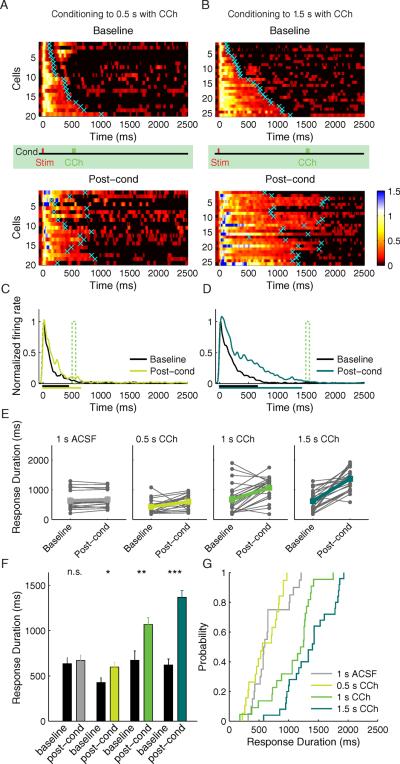
Fig. 5.
Conditioning to two different stimulus-CCh delays, 0.5 s and 1.5 s. A) SDFs before and after conditioning to 0.5 s stimulus-reward interval; n = 19 from 7 animals. Conventions are the same as Fig. 4. B) Plots of SDFs before and after conditioning to 1.5 s stimulus-reward interval; n = 25 from 10 animals. Individual neuronal responses are sorted according to the initial response time. C) Population SDFs conditioned to the 0.5 s stimulus-reward interval before (black) and after (light green) conditioning. D) Population SDFs conditioned to the 1.5 s stimulus-reward interval before (black) and after (dark green) conditioning. The mean neuronal response duration before and after conditioning is shown as the corresponding colored bars below the x axis. E) Connected filled circles represent response times of individual neurons before and after conditioning with ACSF (gray) and with CCh to different stimulus-reward times 0.5 s (light green), 1.0 s (green), 1.5 s (dark green). Post-cond, post-conditioning. F) Mean response times of the neurons before (black) and after (colored) conditioning. Error bars represent S.E.M. * P < 0.05; **P < 0.01; ***P < 0.001, Student's t-test. G) Cumulative probability distributions of the neuronal response times after conditioning with ACSF and CCh. See also Figure S4 & S5.

