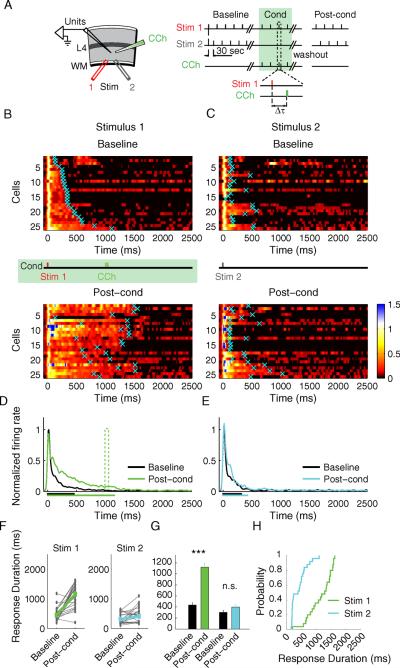
Fig. 6.
Two-pathway experiment. A) Experimental setup. Stim 1 represents the conditioned stimulus; Stim 2 represents the control stimulus. B) SDF's before (baseline) and after (post-cond) conditioning with a 1s stimulus-CCh interval, n = 25 units from 9 animals. Conventions are the same as Fig. 4. C) SDF's of the neurons in response to the control stimulus. Both B) and C) represent responses of the same neurons to Stim 1 and Stim 2; individual neuronal responses are sorted according to the initial duration of response to the Stim 1 electrode. D) Population SDF to the conditioned stimulus before (black) and after (green) conditioning. E) Population SDF to the control stimulus before (black) and after (cyan) conditioning. The mean neuronal response duration before and after conditioning is shown as the corresponding colored bars below the x axis. F) Individual response times of the conditioned (green) and the control (cyan) stimuli. G) Mean Response times of the conditioned and the control stimuli, ***P < 0.001; n.s., not significant; Student's t-test. H) Cumulative probability distributions of the neuronal responses after conditioning.

