
Figure 1.
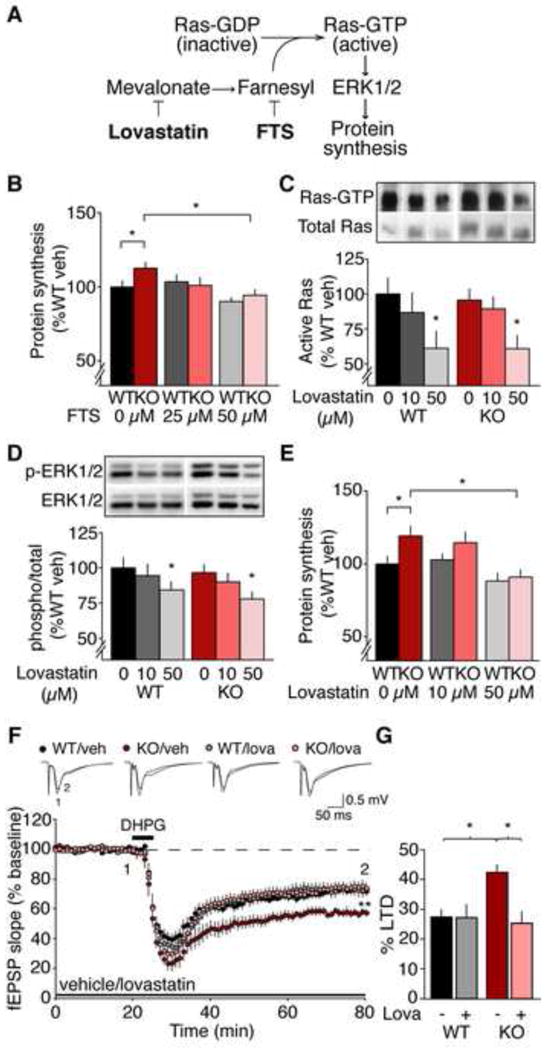
Lovastatin inhibits Ras-ERK1/2 signaling, normalizes excessive protein synthesis, and corrects exaggerated mGluR-LTD in the Fmr1 KO hippocampus. (A) Model of the mechanism by which lovastatin and FTS reduce Ras-ERK1/2 activation and normalize protein synthesis in the Fmr1 KO. (B) Application of FTS corrects excessive protein synthesis in the Fmr1 KO (WT: veh 100 ± 4%, 25 μM 104 ± 5%; 50 μM 90 ± 2%; KO: veh 113 ± 4%, 25 μM 101 ± 5%; 50 μM 94 ± 4%; ANOVA treatment *p = 0.0017; WT vs. KO veh *p = 0.041, KO veh vs. 50 μM *p = 0.00002; n = 15). A small but significant reduction of protein synthesis is also observed with 50 μM FTS in WT (*p = 0.0316). (C) Lovastatin inhibits Ras activation in hippocampal slices (WT: veh 100 ± 11%, 10 μM 87 ± 14%; 50 μM 61 ± 12%; KO: veh 96 ± 8%, 10 μM 89 ± 8%; 50 μM 61 ± 9%; ANOVA treatment *p = 0.0266; WT *p = 0.039, KO *p = 0.015; n = 6). (D) Lovastatin downregulates ERK1/2 (WT: veh 100 ± 7%, 10 μM 94 ± 8%; 50 μM 84 ± 5%; KO: veh 97 ± 5%, 10 μM 90 ± 6%; 50 μM 78 ± 5%; ANOVA treatment *p = 0.0037; WT *p = 0.035, KO *p = 0.008; n = 15). (E) Lovastatin normalizes protein synthesis in Fmr1 KO hippocampal slices (WT: veh 100 ± 5%, 10 μM 103 ± 4%; 50 μM 88 ± 5%; KO: veh 119 ± 6%, 10 μM 115 ± 7%; 50 μM 91 ± 4%; ANOVA genotype x treatment *p = 0.0332; WT vs. KO veh *p = 0.019, KO veh vs. 50 μM *p = 0.011; n = 11). (F) LTD was induced with 50 μM R,S-DHPG and extracellular recordings were performed in area CA1. In the presence of vehicle, greater LTD is observed in the Fmr1 KO versus WT (WT veh 72.5 ± 2.5%, KO veh 57.5 ± 2.5%, *p = 0.005, n = 9–10). 50 μM lovastatin significantly reduces LTD magnitude in the Fmr1 KO to WT levels (WT lova 72.7 ± 4.4%, KO lova 74.5 ± 3.4%; KO veh vs. lova *p < 0.001, n =11–13), but has no significant effect on LTD in the WT (WT veh vs. lova p = 0.869). Field potential traces are averages of all experiments, and were taken at times indicated by numerals; Scale bars = 0.5 mV, 5 ms. (G) Lovastatin significantly reduces LTD magnitude in the Fmr1 KO to WT levels (ANOVA genotype x treatment *p = 0.021). LTD magnitude was assessed by a comparison of the averaged last 5 minutes pre-DHPG and the last 5 min of recordings (minutes 55–60 post-DHPG). N = animals. Error bars = s.e.m.