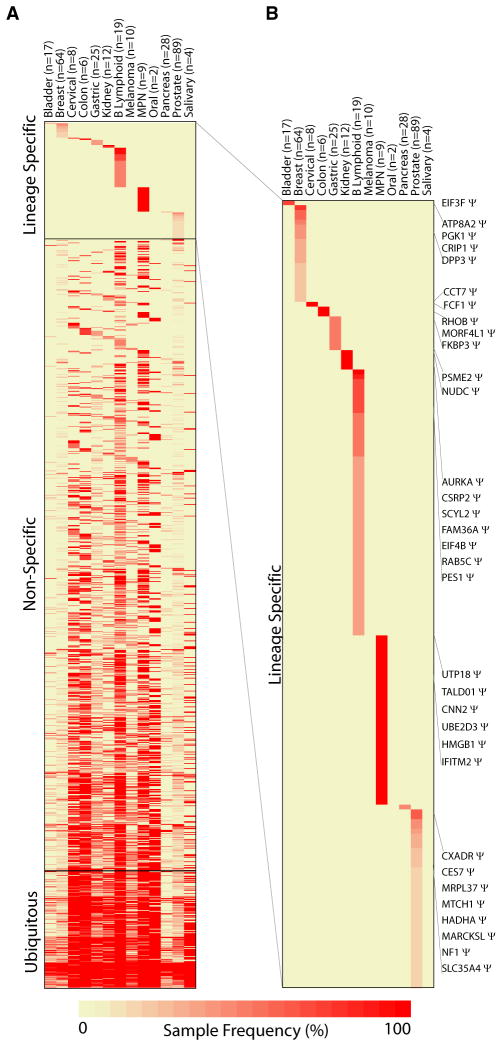
Figure 3. Tissue/Lineage-Specific Pseudogene Expression Profiles.
(A) Heatmap of pseudogene expression sorted on the basis of tissue-specific expression displays tissue-specific (top), tissue-enriched/nonspecific (middle), and ubiquitously expressed pseudogenes (bottom).
(B) Zoomed-in version of the top panel displaying tissue-specific expressed pseudogenes. The columns represent different tissues, with the number of samples in parentheses. The rows represent individual clusters mapping to specific pseudogenes. The color intensity represents the frequency (%) of samples in a tissue type showing expression of a given pseudogenes (according to the scale indicated at the bottom). The key clusters are labeled with their corresponding parental gene symbols. MPN, myeloproliferative neoplasms.
See also Table S6.

