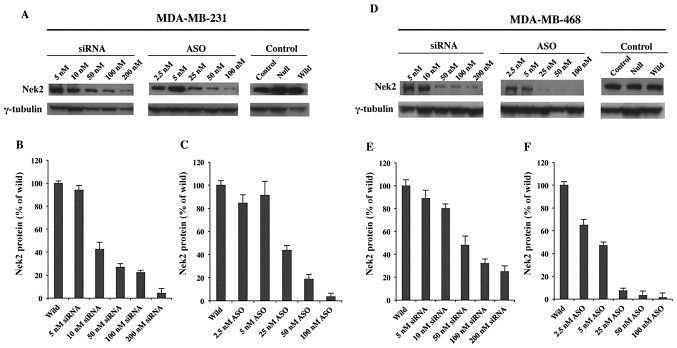
Figure 2.
Protein expression levels of Nek2 siRNA or ASO transfected M231 and M468 TNBC cells analyzed by western blot analysis. (A and D) Nek2 protein expression after 48-h transfection in M231 and M468 cells, respectively, with 5, 10, 50, 100 and 200 nM of Nek2 siRNA (left) or 2.5, 5, 25, 50 and 100 nM of Nek2 ASO (center). Control cells were treated with control siRNA, Lipofectamine 2000 alone or untreated (right). γ-tubulin was used as the loading control for each cell line. The bar graphs represent Nek2 protein expression levels with different concentrations of (B and E) siRNA or (C and F) ASO. Nek2 protein expression is given as a percentage standardized against Nek2 expression levels in wild-type cells. Average of three independent experiments and standard deviations are shown (n=3; error bar, standard deviations).

