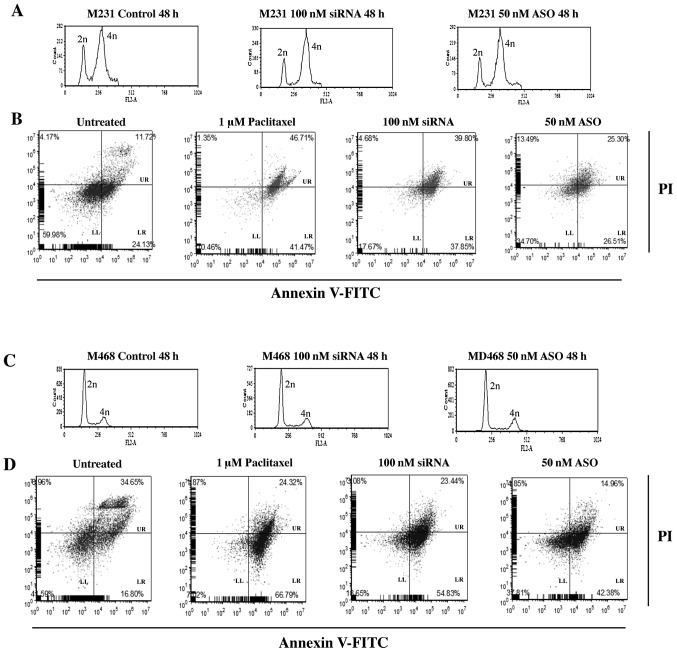
Figure 5.
Representative results of cell cycle distribution and apoptosis for 100 nM Nek2 siRNA or 50 nM Nek2 ASO in M468 and M231 TNBC cells. (A) M231 and (C) M468 cell cycle distribution of non-transfected (left), 100 nM siRNA (middle), or 50 nM ASO (right). Cell cycle was synchronized using a double thymidine block. Time indicates released time after thymidine treatment. After cell cycle synchronization, cells were transfected with siRNA or ASO. Cells were harvested 48 h later. Cells were fixed in ethanol and the DNA content was analyzed by flow cytometry following propidium iodide (PI) staining. In A and C, the x-axis demonstrates fluorescence intensity based on DNA content, and the y-axis corresponds to the number of fluorescent cells. B and D represent parallel cell cultures stained using FITC-conjugated Annexin V and PI to analyze apoptosis using flow cytometry (LL, live cells; LR, apoptotic cells; UR, dead, necrotic and late apoptotic cells). Cells were treated with 1 μM paclitaxel, 100 nM siRNA or 50 nM ASO, respectively. Data are representative results from at least 3 independent experiments demonstrating reproducibility.

