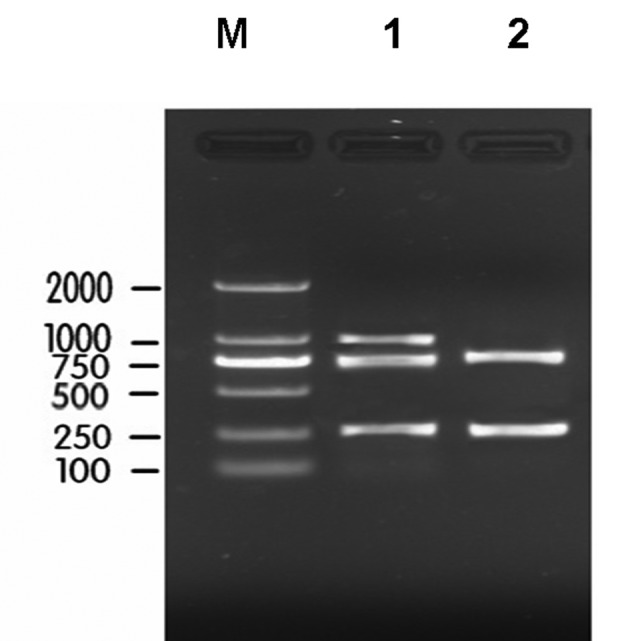
Figure 1.

Electropherogram of PCR amplification products of the class I, II and III integrons. M, DNA marker; lanes 1 and 2, multiplex PCR amplification. PCR bands show that the amplification products of class I, II and III integrons were 280, 788 and 979 bp, respectively.
