
Figure 9.
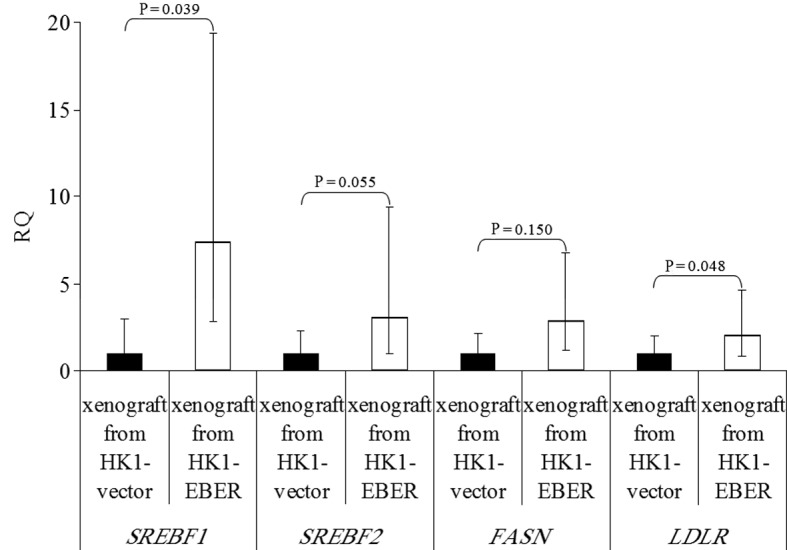
Expression of SREBF1 and 2, FASN and LDLR in xenografts formed from HK1-EBER and the control, quantified by qRT-PCR. The results are expressed as RQ to the control xenografts following normalization to the endogenous control ACTB. The trend in differential gene expression in vivo was consistent with that observed in vitro. P>0.05, HK1-EBER overexpression of SREBF2 and FASN vs. control. P≤0.05, HK1-EBER overexpression of SREBF1 and LDLR vs. control. Limited significance may be explained by a large variation in expression levels. SREBF, sterol regulatory element binding protein; FASN, fatty acid synthase; LDLR, low-density lipoprotein receptor; EBERs, Epstein-Barr virus-encoded RNAs; qRT-PCR, quantitative reverse transcription polymerase chain reaction; RQ, relative quantification; ACTB, β-actin.