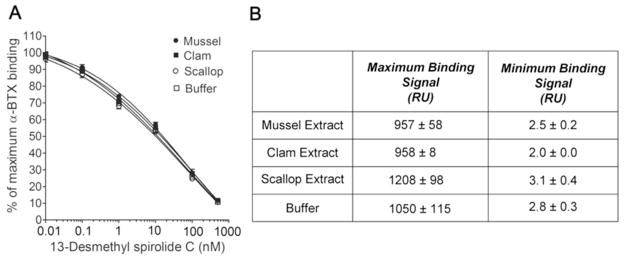
Figure 3.

Effect of mussel, clam and scallop matrices on the detection of 13-desmethyl spirolide C using the nAChR/microsphere-based assay. (A) Calibration curves of 13-desmethyl spirolide C in mussel, clam and scallop extracts and in buffer using the nAChR inhibition assay. The data are expressed as percentage of biotin-α-BTX maximum binding response. The calibration curves were obtained with a four-parameter fit. The four curves belong to non-matched experiments (mean ± SEM; mussel, n = 6; clam, n = 2; scallop, n =5 and buffer, n = 8). (B) Maximum and minimum binding signals in shellfish extracts and buffer from the experiments in (A).
