
Fig. 3.
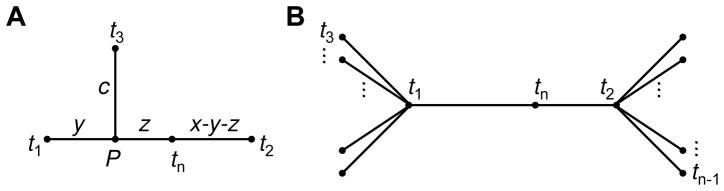
The case of an additive distance matrix for n taxa. (A) Illustration of distances in the model. In the text it is shown that y = 0. (B) The structure required for a tree. Taxa t1 and t2 lie at multifurcating nodes, with tn on the line connecting them. The leaves connected to the multifurcations have labels t3, t4, …, tn−1.