
Fig. 2.
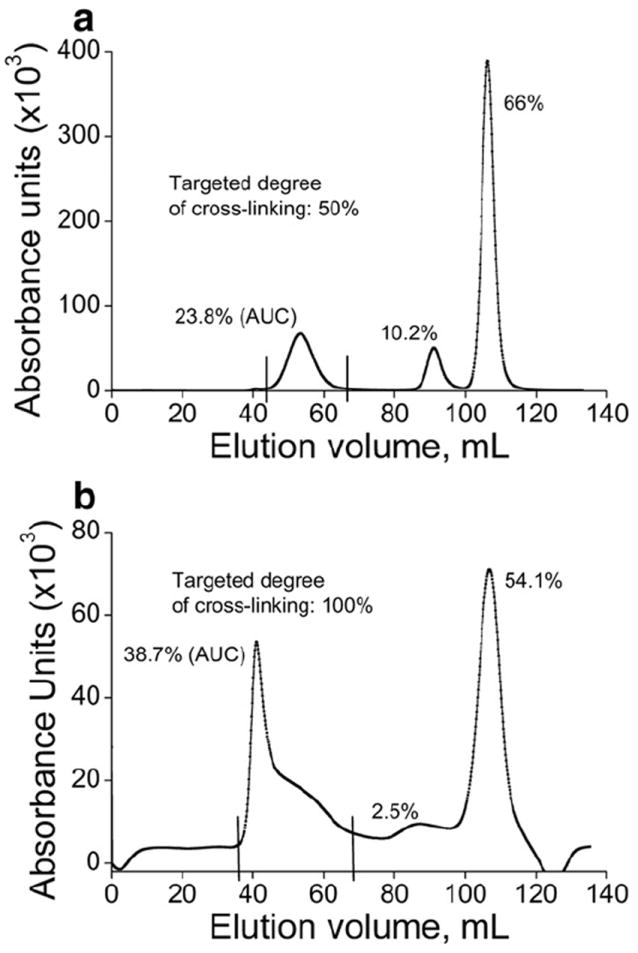
FPLC chromatogram profiles depicting purification of DTSSP-cross-linked (a) SOD1 cl-nanozyme (S2) and (b) catalase cl-nanozyme (C2). S2 or C2 was loaded onto a HiPrep 16/60 Sephacryl™ S-400 HR column and eluted using 10 mM HBS (pH 7.4) at a flow rate of 0.5 mL/min. AUC analysis determined the proportion of each fraction in the sample.