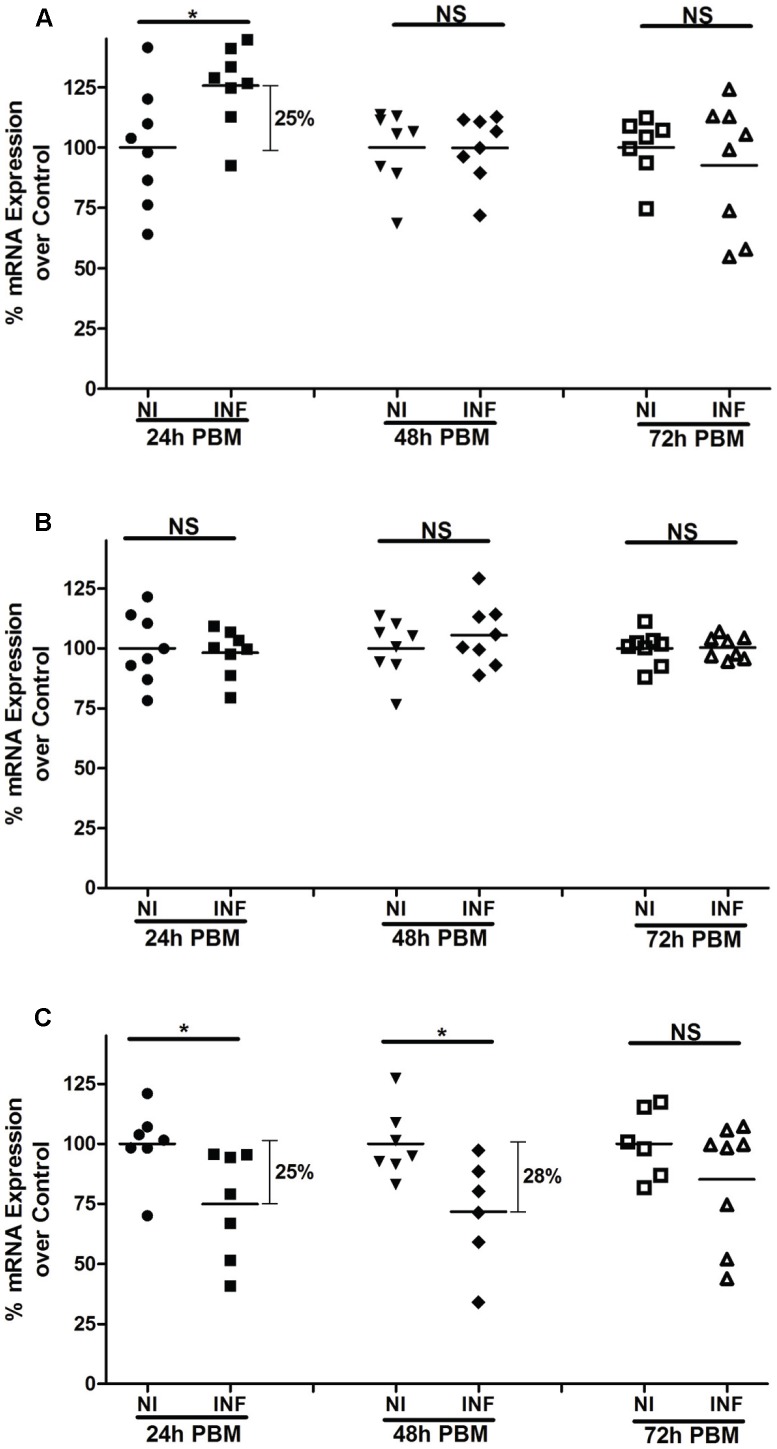
Figure 5. Modulation of peritrophin mRNA expression upon Le. major infection.
qRT-PCR assays depicting differences in PpPer1 (A), PpPer2 (B), and PpPer3 (C) mRNA levels between non-infected and Le. major infected midguts dissected at 24 h, 48 h, and 72 h PBM. Each dot (symbol) represents the mRNA expression levels in a single midgut whereas horizontal bars indicate mean expression levels. The cDNA encoding the S3 protein of the 40S ribosomal subunit was used as the housekeeping control gene. The mean expression of non-infected midguts was used as a standard (100%) for comparisons to the percentage of mRNA expression of Le. major infected midguts for each time point. NI: Non-infected. INF: Le. major infected. NS: Not significant. *: Statistically significant, p<0.05.

