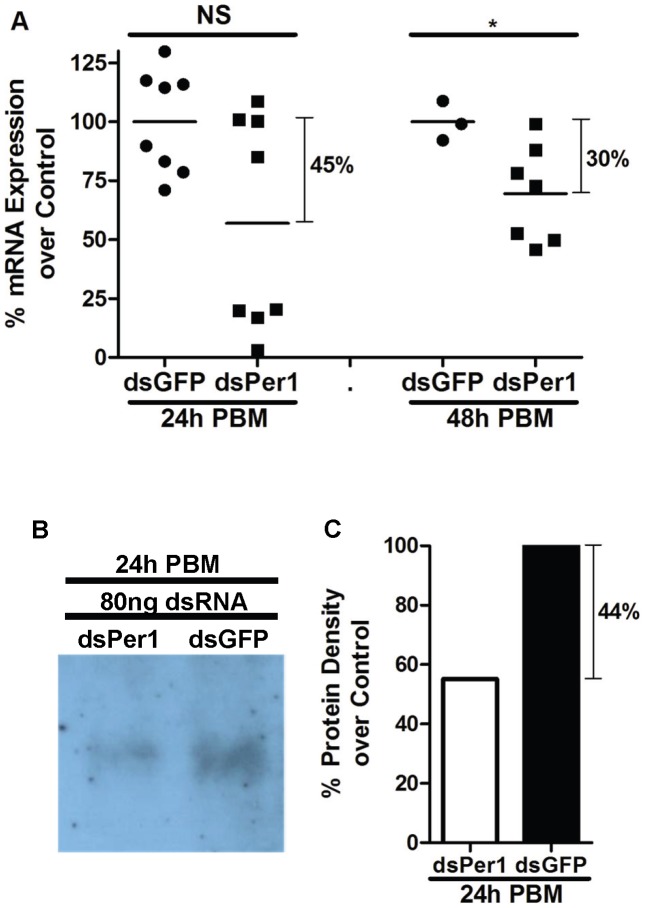
Figure 8. PpPer1 knockdown at mRNA and protein levels.
(A) real time qRT-PCR showing PpPer1 mRNA level reduction in dsRNA-injected (dsPer1) P. papatasi compared to control injected (GFP dsRNA). Knockdown effects in PpPer1 mRNA expression were assessed at 24 h and 48 h PBM that corresponded to 72 h and 96 h post dsRNA injection. Each symbol represents mRNA expression levels in a single midgut. Horizontal bars indicate mean expression levels. The S3 gene was used as the housekeeping control gene. The mean expression of PpPer1 in dsGFP-injected flies was used as 100% standard. NS: Not significant. *: Statistically significant, p<0.05 (Unpaired t-test). (B) Western blot assay showing reduction in PpPer1 protein levels at 24 h PBM (72 h after dsRNA injection) in dsPer1-injected flies compared to dsGFP-injected (chemiluminescence development). Nine and a half micrograms of protein were loaded onto 10% NuPAGE gel. (C) Densitometry showing 44% reduction in the intensity of PpPer1 protein band obtained after chemiluminescence development compared to the PpPer1 band intensity of dsGFP-injected flies. For all PpPer1 knockdown assays, 80 ng of dsRNA was injected intrathoracically into 3-to-5 day old P. papatasi females fed on 30% sucrose solution ad libitum.

