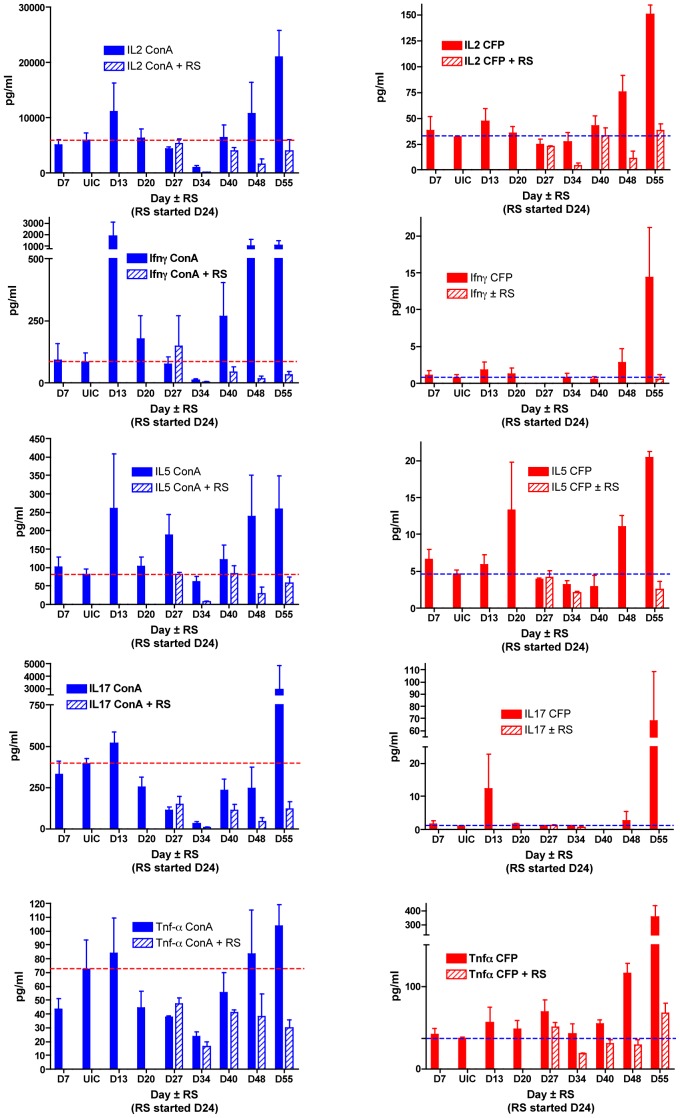
Figure 4. Cytokine production responses to concanavalin A or mycobacterial protein before and after Rifampin-Streptomycin treatment.
The dotted line indicates the levels in uninfected control (UIC) mice. Responses by untreated mice are indicated by solid bars and those by rifampin-streptomycin (RS) treated mice are indicated by hatched bars. Responses of splenocytes stimulated with Concanavalin A (ConA) are in the left column and with mycobacterial culture filtrate proteins (CFP) in the right column for representative cytokines, from top to bottom, IL-2, IFN-γ, IL-5, IL-17, and TNF-α. Data based on 3 mice per group per time point.

