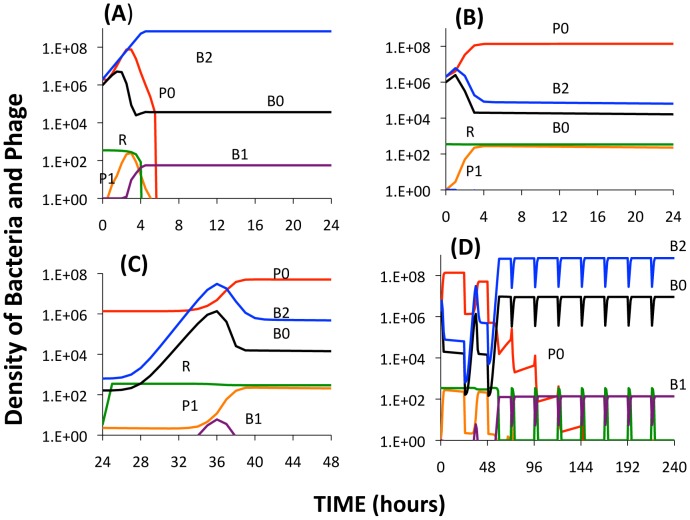
Figure 10. Simulation results of the extended model.
Changes in the densities of bacteria and phage in cultures inoculated with WT phage (P0), second-order BIMs (B2), and WT cells upon which the phage can replicate (B0). The first-order BIMs (B1) and first-order phage (P1) are respectively produced by spacers added to the CRISPR region and generated by mutation, with probabilities of 10−6 per cell or phage per hour. The variable R is the concentration of the limiting resource. The bacterial growth and phage infection parameters in these simulations are the same as those in Figure 2. Save for (A) the parameters for the production and action of LY and persistence are as follows: vL = 10−6, KL = 106, η = 1.4, g = h = 0.01. The initial concentration of the resource at the start of a transfer is 350 µg/ml. The cultures were initiated with 2×10⁶ B0 and B2 cells and 2×10⁶ P0 phage. Panel A: No LY produced (vL = 0). Panel B: The first transfer of the culture. Panel C: The second transfer. Panel D: sequential transfers (approx. 2×10⁴).

