
Figure 1. Common axes explain a large proportion of expression variation.
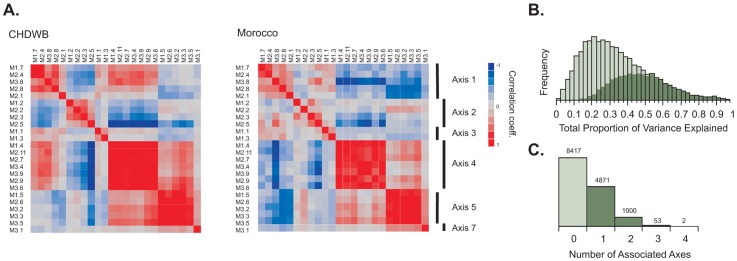
(A) Hierarchical clustering of the PC1 scores for 24 Expression Modules in Ref [12] in the Atlanta CHDWB and Morocco datasets shows complete agreement in clustering into 6 meta-modules. These define 6 of the Axes described here, while a 7th Axis emerged on further decomposition of Module 3.1 (B) The frequency distribution of proportion of variance explained by all 9 Axes for each of 14,343 transcript probes (light green) and 7,538 transcript probes (dark green) Bonferroni significant for at least one Axis in a multiple regression. Inclusion of the two additional axes not corresponding to the Chaussabel modules only explains an extra 4% of the variance relative to the first seven. (C) The number of Bonferroni significant axes per transcript in the CHDWB dataset, showing that 39% (5622/14343) of transcript probes associate most strongly with a single axis.