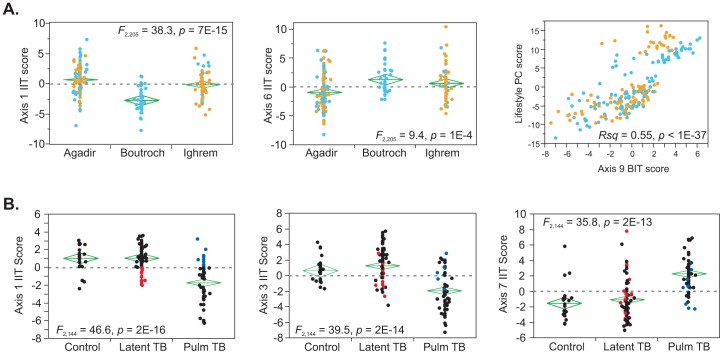
Figure 3. Environmental influences on the Axes.
(A) Differences in Axis scores between geographic locations in Morocco (City of Agadir, villages of Boutroch and Ighrem: Berbers, blue; Arabs, yellow) are restricted to Axes 1, 2, 6, and 9, where Axis 6 distinguishes rural from urban, and Axes 1 and 2 distinguish Boutroch only. A grouping of Boutroch residents with Arab women in Ighrem against all others, which represents the major “lifestyle” effect on gene expression [13] generates a PC score that is highly concordant with Axis 9. (B) In the study by Berry et al [15], pulmonary tuberculosis differs from latent tuberculosis and healthy controls along four Axes (1, 3, 5 and 7), but not along Axes 2 or 5. A small number of individuals shown in red and blue are mis-classified for Axis 1 and 3, and likely have intermediate TB activity status, but this is not apparent for the differentiation of the interferon-response axis 7. None of the axes distinguish latent TB from control. PC1 for the diagnostic transcripts reported in [12] is highly correlated with Axis 1 (London sample R squared = 0.73, p = 10−28, South African sample R squared = 0.81, p = 10−19) and likely reflects divergence along this axis.

