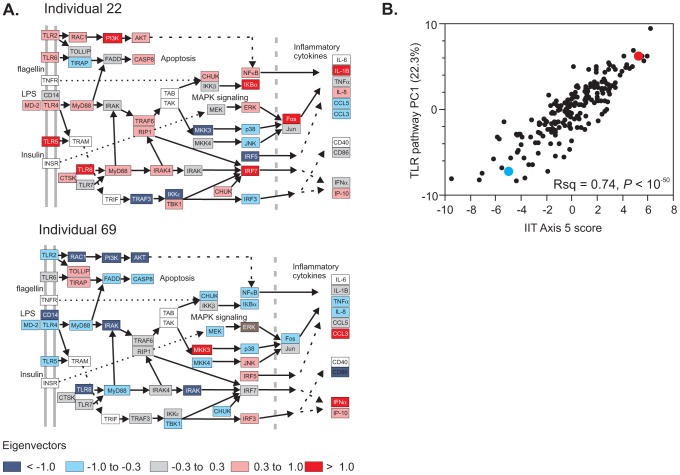
Figure 6. Pathway analysis of transcript abundance.
The relative transcript abundance of 51 transcripts in the KEGG TLR signaling pathway (map04620) is shown for two representative divergent individuals (A). These genes are all co-regulated along Axis 5 (B), resulting in differential activity throughout the pathway. Two representative individuals at either extreme, indicated in red (individual 22) and blue (individual 69) in panel B, clearly differ with respect to which genes have high or low expression relative to regulation of apoptosis, MAPK signaling, and inflammatory cytokine production. This likely has consequences for the sensitivity of neutrophil and other immune cell function. Red, high expression; blue, low expression; gray intermediate, scaled as the eigenvector of PC1.

