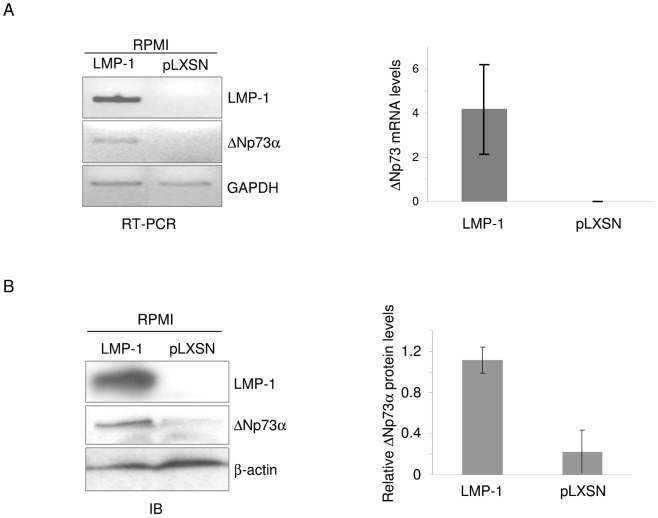
Figure 2. EBV LMP-1 induces up-regulation of ΔNp73α.
(A and B) RPMI-pLXSN (pLXSN) and RPMI-pLXSN-LMP-1 (LMP-1) cells were collected and processed for the preparation of total RNA or protein extract. RNA was retro-trancribed to cDNA and ΔNp73, LMP-1 and GAPDH mRNA levels were measured by RT-PCR (A right panel) or quantitative PCR (A left panel). Protein extracts were analyzed by immunoblotting using the indicated antibodies (B left panel). The ΔNp73α protein signal was quantified by Quantity one (Biorad), normalized on the levels of β-actin, and the values obtained were reported in the histogram (B left panel). The data are the mean of three independent experiments.

