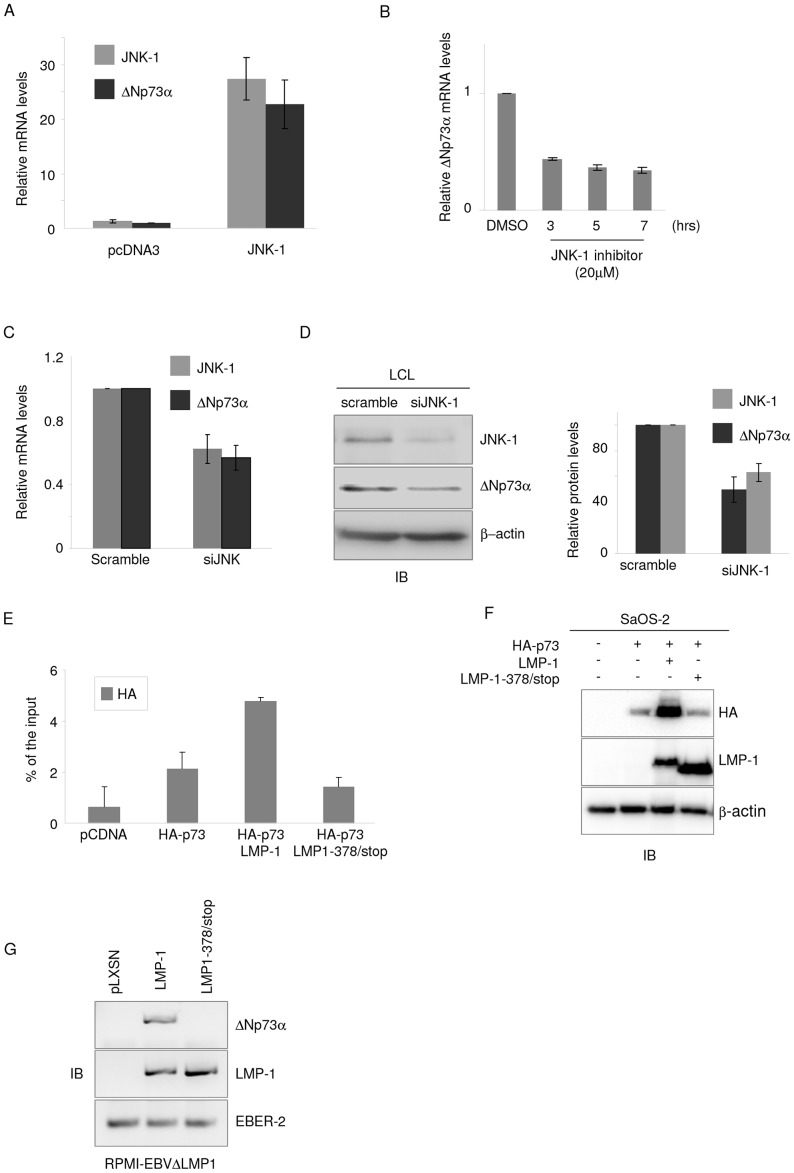
Figure 5. JNK-1 is involved in LMP-1-mediated activation of ΔNp73α expression.
(A) BJAB cells were transfected with JNK-1 expression vector or empty pcDNA3 construct as control. After 36 hours cells were collected and processed for RNA extraction. The levels of ΔNp73, JNK-1 and GAPDH transcripts were determined by quantitative RT-PCR. The data are the mean of three independent experiments. The difference of ΔNp73α mRNA levels in mock cells (BJAB) and BJAB expressing JNK-1 is statistically significant (p value = 0.022). (B) LCLs were treated with JNK-1 inhibitor (SP600125) at 20 µM. After the indicated times cells were collected and processed for RNA extraction. ΔNp73 mRNA levels were determined by quantitative RT-PCR. The data are the mean of three independent experiments. The difference of ΔNp73α mRNA levels in LCLs cultured in presence (7 hours) or absence (DMSO) of JNK-1 inhibitor is statistically significant ((p value = 0.015). (C and D) Scrambled siRNA and siRNA for JNK-1 (siJNK-1) was transfected in LCLs. Thirty-six hours after transfection, cells were collected and processed for RNA or total cells proteins extraction. (C) ΔNp73 and JNK-1 transcript levels were determined by quantitative RT-PCR. The data are the mean of three independent experiments. The difference of JNK-1 or ΔNp73α mRNA levels in LCLs transfected with scramble siRNA or siJNK-1 is statistically significant (p value = 0.008 and p value = 0.0002, respectively). (D) Forty µg of whole cell lysate was analyzed by immunoblotting for the levels of ΔNp73α, JNK-1 or β-actin proteins (left panel). ΔNp73α and JNK-1 protein signal was quantified by Quantity one (Biorad), normalized on the levels of β-actin, and the values obtained were reported in the histogram (right panel). The data are the mean of three independent experiments. The difference of ΔNp73α mRNA levels in LCLs transfected with scramble siRNA or siJNK-1 is statistically significant (p value = 0.01). (E and F) SaOS-2 cells were transfected with different pcDNA3 constructs in the indicated combinations. After 36 hours, cells were collected and fixed for ChIP experiments performed with a HA antibody and followed by quatitative PCR (E) or analysed by immunoblot for the indicated proteins (F). (G) RPMI- EBVΔLMP-1 cells were transduced with pLXSN, pLXSN-LMP-1 wild-type or 378/Stop mutant retroviruses. Cells were selected for neomycin resistance, and then collected for RNA extraction. The levels of ΔNp73α, LMP-1 and EBER2 transcript were determined by RT-PCR.

