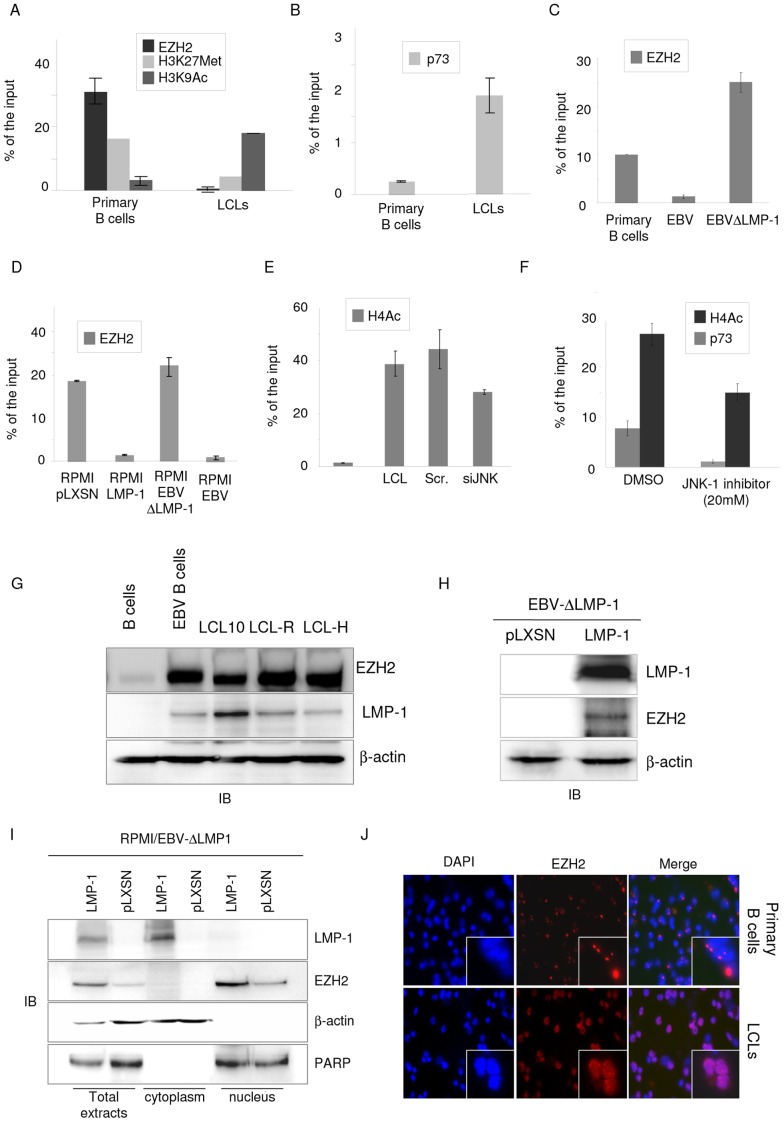
Figure 6. EBV infection of B cells determines epigenetic changes on the p2 promoter.
(A and B). Primary B cells were infected and immortalized with EBV (LCL). At the day of the extraction and 2-weeks post infection, primary and immortalized B cell respectively, were fixed and processed for quantitative ChIP analysis. (A) ChIP was carried out using EZH2, Histone 3 Trimethylated Lysine 27 (H3K27), Histone 3 acetylated Lysine 9 (H3K9Ac) antibodies and IgG antibody as negative control. After ChIP the eluted DNA was used as template for quantitative PCR with primers spanning the p73RE within the ΔNp73 promoter. Part of the total chromatin fraction (1/10) was processed at the same time and used as input. After subtracting the background of the unspecific binding (ChIP for IgG), the amount of promoter specifically bound by each protein was expressed as a percentage of the total amount of ΔNp73 promoter (% of input). (B) Quantitative-ChIP for p73 was carried out and analyzed as described in the legend of Figure 6A. The data shown in (A) and (B) are the mean of three independent experiments with primary B cells of three different donors. The differences between the % of binding to the promoter in primary B cells and in LCL are significant (p value = 0.01 for EZH2, p value = 0.01 for H3K27Met, p value = 0.002 for H3K9Ac). (C) Primary B cells or primary B cells infected with wild-type EBV (EBV) or EBV lacking the entire LMP-1 gene (EBVΔLMP-1) were fixed and processed for EZH2 ChIP by using the LowCell ChIP Kit (Diogenode). Quantitative ChIP analysis was performed according to the manufacturers' protocol. The data are the mean of two independent experiments. The difference between the % of EZH2 binding to p2 in primary and LCL is significant (p value = 0.01). (D) RPMI-pLXSN (pLXSN) and RPMI-pLXSN-LMP-1 (LMP-1), RPMI EBV and RPMI EBVΔLMP-1 were fixed and processed for ChIP for EZH2 as described in figure 6C. The difference in the levels of EZH2 recruited to ΔNp73α promoter in the different conditions is significant (pLXSN vesus LMP-1 p value = 0.038, EBVΔLMP-1 versus EBV p value = 0.008). (E) Primary and LCLs non-transfected or transfected with scramble (Scr) or JNK-1 siRNA were fixed and processed for quantitative ChIP analysis using an antibody against the acetylated form of histone H4 following the procedure described in the legend of Figure 6A. The data are the mean of three independent experiments. The difference in the levels of H4Ac binding to ΔNp73α promoter in the different conditions is significant (primary B cells versus LCL p value = 0.002, scramble siRNA versus JNK-1 siRNA p value = 0.04). (F) LCLs were cultured in absence (DMSO) or presence of 20 µM of JNK-1 inhibitor for 5 hours, fixed and processed for quantitative ChIP analysis using an antibody against the acetylated form of histone H4 or p73 following the procedure described in the legend of Figure 6A. The data are the mean of three independent experiments. The difference in the percentage of H4Ac or p73 binding to ΔNp73α promoter in the different conditions is significant (DMSO versus JNK-1 inhibitor p value = 0.004 for H4Ac and p value = 0.001 for p73). (G) Primary B cells and EBV-positive B cells were analyzed by immunoblotting for the levels of the indicated proteins. (H) Forty µg of total extract from RPMI- EBVΔLMP-1 pLXSN and pLXSN-LMP-1 cells were analyzed by immunoblotting for the levels of the indicated proteins. (I) Nuclear and cytoplasmic fractions from RPMI- EBVΔLMP-1 pLXSN and pLXSN-LMP-1 were analyzed by immunoblotting for the levels of LMP-1, EZH2, β-actin and PARP. (J) Cellular localization of EZH2 was determined by immunofluorescent in Primary B cells and LCLs. Fluorescent signal was visualized using Axioplan2 microscope from Zeiss laser microscopy. The pictures shown are representative of three independent staining.

