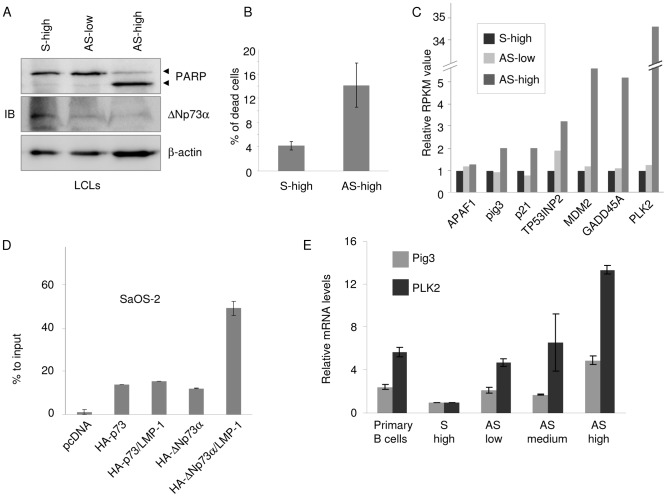
Figure 7. ΔNp73α inhibit expression of pro-apoptotic genes in EBV-infected cells.
(A) LCLs were transfected with 2 µg S (S-high) and 2 increasing concentration of AS (0.5 µg, AS-low and 2 µg, AS-high), against ΔNp73α. Thirty hours after transfection cells were collected, the total lysates were extracted and analysed by immunoblotting for the indicated proteins. (B) Cells were treated as described in the legend of Figure 7A and live stained with PI. The percentage of PI stained cells (dead cells) were calculated by flow cytometer as explained in Material and Methods. (C) LCLs treated with S-high (2 µg), AS-low (0.5 µg) and AS-high (2 µg) were used to perform RNAseq. The p53 target genes which were significantly deregulated (p value<0,01 EdgeR software) in S vs. AS were represented in the histogram and expressed as relative RPMK values. (D) SaOS-2 cells were transfected with different pcDNA3 constructs in the indicated combinations. After 36 hours, ChIP was performed using an anti HA-tag antibody and followed by real-time PCR, using primers flanking the p53-RE BS1 within the PLK2 promoter. The percentage of binding of p73 and ΔNp73 to PLK2 promoter was determined as described in the legend of Figure 4A. (E) LCLs were transfected with 2 µg of ΔNp73α S (S-high) and 3 increasing concentration of ΔNp73α AS (0.5 µg, AS-low; 1 µg, AS-medium; 2 µg, AS-high). Thirty-six hours after transfection, cells were collected and processed for RNA extraction. Pig3 and PLK2 mRNA levels were determined by quantitative RT-PCR. The data are the mean of two independent experiments. The difference of Pig3 or PLK2 mRNA levels in LCLs transfected with S and AS is statistically significant (p values = 0.02 and 0.01 for Pig3 and PLK2 respectively).

