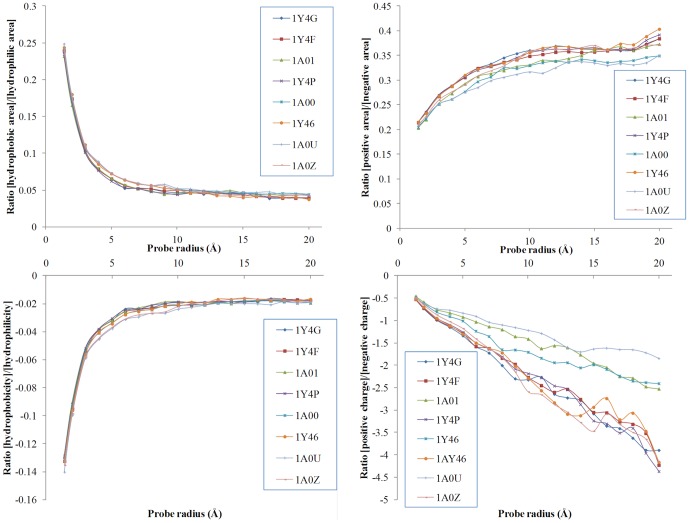
Figure 7. Ratio of the molecular surface properties for single-point mutants (haemoglobin structures) as a function of the probe radius.
The top panels represent the ration between the hydrophobic and positive areas, respectively, reported to the hydrophilic and negative areas, respectively. The bottom panels represent the ratios of the respective properties. The members of the sub-set are as follows: 1Y4F (W37A); 1A01 (W37A); 1Y4P (W37E); 1A00 (W37Y); 1Y46 (W37Y); 1Y4G (W37G); 1A0U (V1M); and 1A0Z (V1M).

