
Figure 1. Comparison of frequencies and magnitudes of responses against the different viral particles and peptides pools tested.
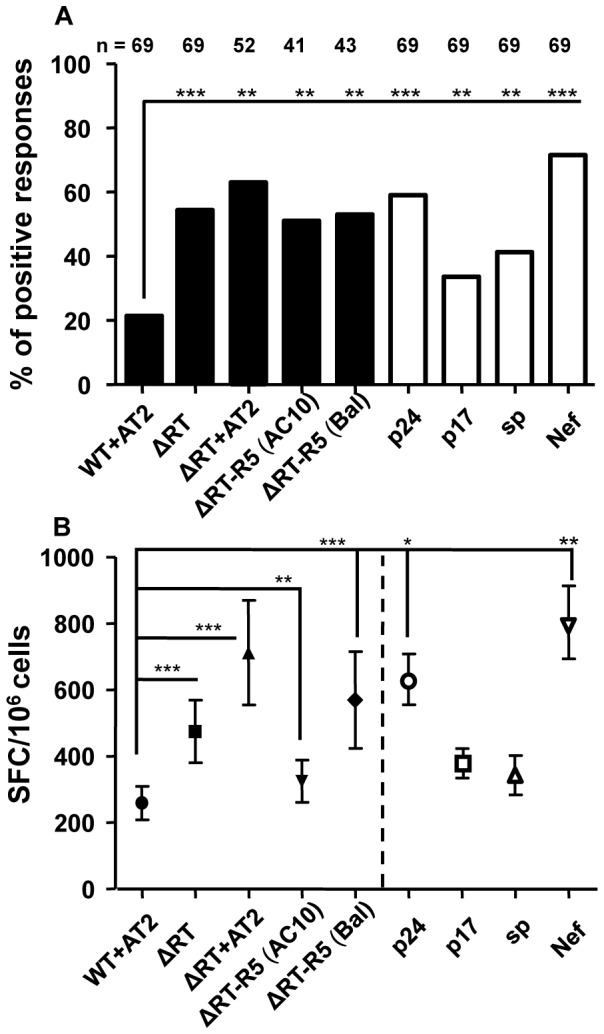
(A) Bars show the percentage of individuals with positive response to the different constructs (Black bars) and the gag p24, p17 and small proteins (sp) and nef peptide pools (White bars) among the samples of HIV+ individuals tested. (B) Each symbol represents the mean of SFC (spot forming cells/106 cells) ± SEM counted per condition after background subtraction. P values were calculated using the Wilcoxon Matched-Pairs Ranks test for continuous variables and χ2-test for categorical variables. The magnitude of response was significantly different among indicated stimuli (*p<0.05; **p<0.01; ***p<0.001).