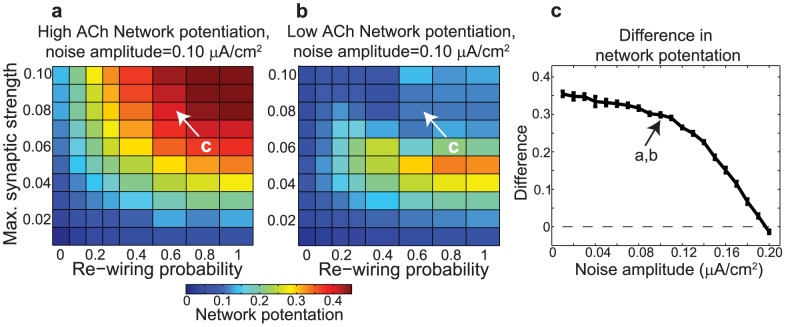
Figure 4. Effects of noise amplitude on the difference in network potentiation between networks with high and low cholinergic modulation.
(a,b) Network potentiation as a function of re-wiring probability (x-axis) and maximum synaptic strength  (y-axis) for networks with (a) high and (b) low cholinergic modulation, with noise amplitude fixed at
  . Note that high-ACh networks exhibited much greater potentiation than low-ACh networks for
  . (c) Difference in network potentiation between high- and low-ACh networks as a function of noise amplitude for the network parameters indicated by arrows in panels (a) and (b).

