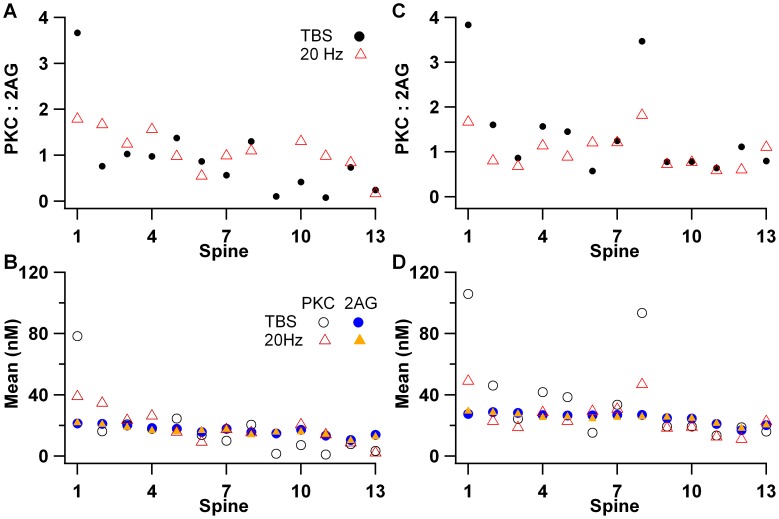
Figure 10. Summary of spatial specificity in 20 µm dendrite with 13 spines (see fig. 1 ).
(A) Ratio of active PKC to 2AG versus spine for both theta burst stimulation (TBS) and 20 Hz stimulation. The ratio is much higher in stimulated spine 1 for TBS, then decreases slightly with distance from the non-stimulated spine. (B) Mean value of active PKC or 2AG exhibits a similar pattern as the ratio. PKC is much greater for the stimulated spine 1, especially for TBS, and PKC activity is close to basal for the four spines furthest from the stimulation. In contrast, 2AG decreases slightly with distance from stimulated spine, independent of stimulation pattern. (C,D) When spines 1 and 8 are stimulated with TBS, the ratio of PKC to 2AG (C), as well as mean PKC activity itself (D), is much higher for the stimulated spines as compared to non-stimulated spines. Mean PKC activity in the non-stimulated spines is slightly higher, but spatial specificity is still strong. Mean 2AG is similar regardless of one or two spines being stimulated.

