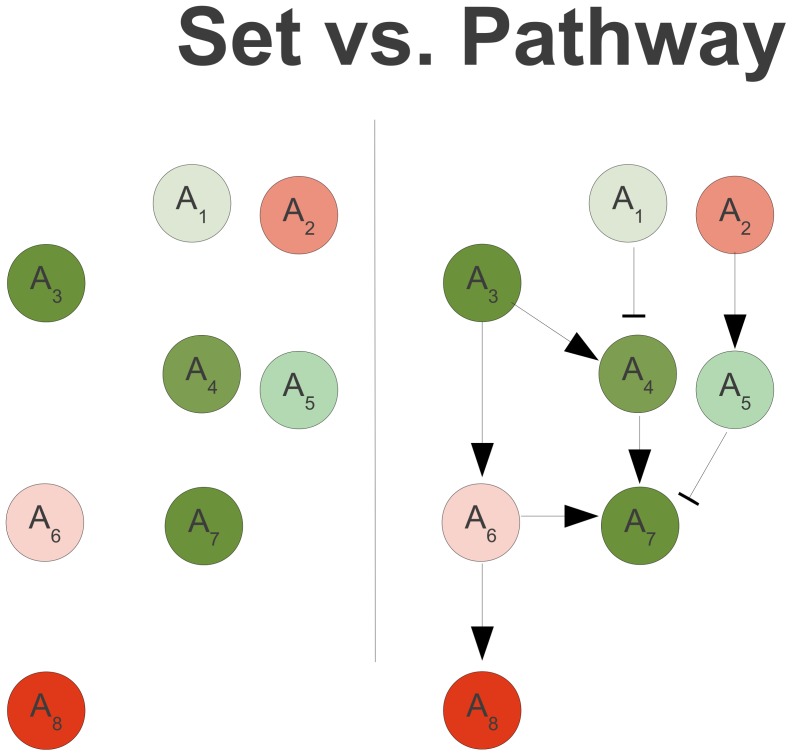
Figure 1. Set vs. pathway.
Coloration from green to red represent differential expression levels, where dark green corresponds to high over expression and dark red indicates severe under expression. Edges with arrows and bars represent catalytic and inhibitory relationships, respectively. Considering A1..A8 as one set results in inconclusive patterns of gene expression. By considering pathway relationships, A3A4A7 is recognized as a path of differentially expressed genes.

