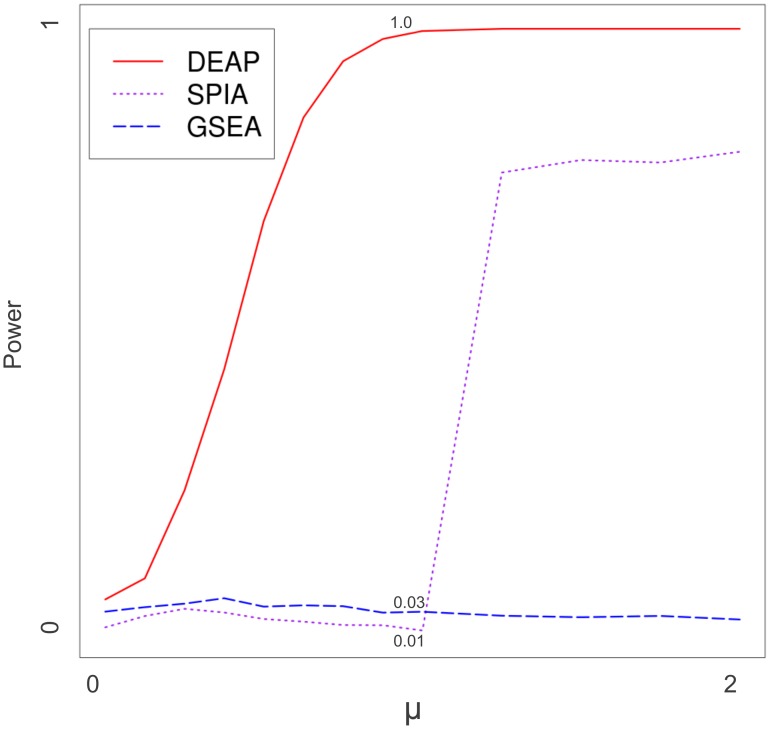
Figure 4. Power curve, variable pathway effect.
Performance of GSEA, SPIA, and DEAP are compared as pathway effect (μ) changes. Specific values are indicated at μ = 1. Power (y-axis) is the ratio of simulations, out of 5000 (5 pathways, 1000 simulations each), which were identified as significant (p<0.05). Constants were σ2g = 0 and sample size = 10.

