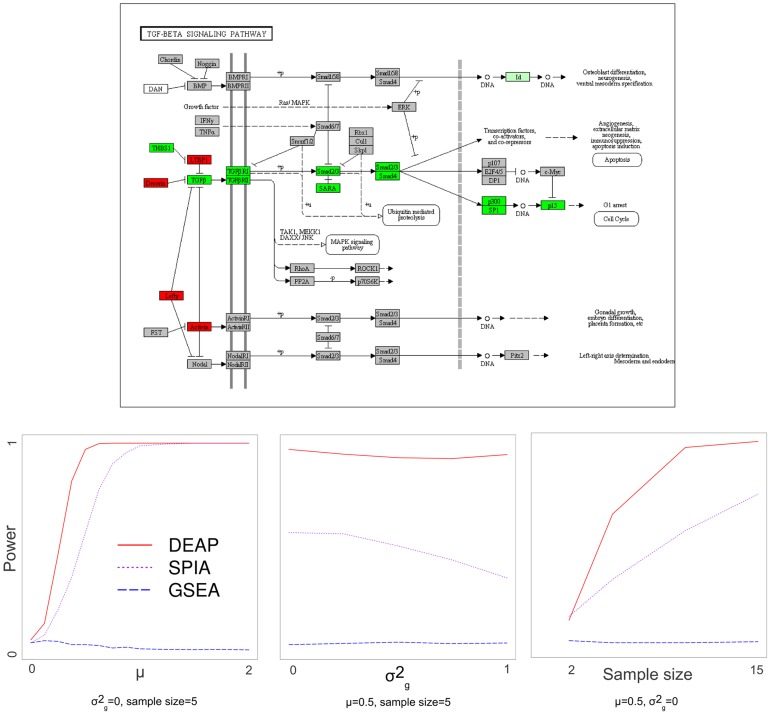
Figure 8. Simulated data on the TGFβ signalling pathway, power vs. pathway effect, variance, and sample size.
At the top, the KEGG TGFβ signaling pathway is illustrated, with green, red, and grey nodes representing nodes whose simulated values were +μ, −μ, and 0, respectively [13]. The nodes are colored to indicate activity leading to G1 arrest in the cell cycle. At the bottom, power for detecting significant differential expression in this pathway is illustrated with respect to pathway effect, variance, and sample size. Figure adapted from http://www.genome.jp/kegg-bin/show_pathway?map04350 with permission from KEGG.

