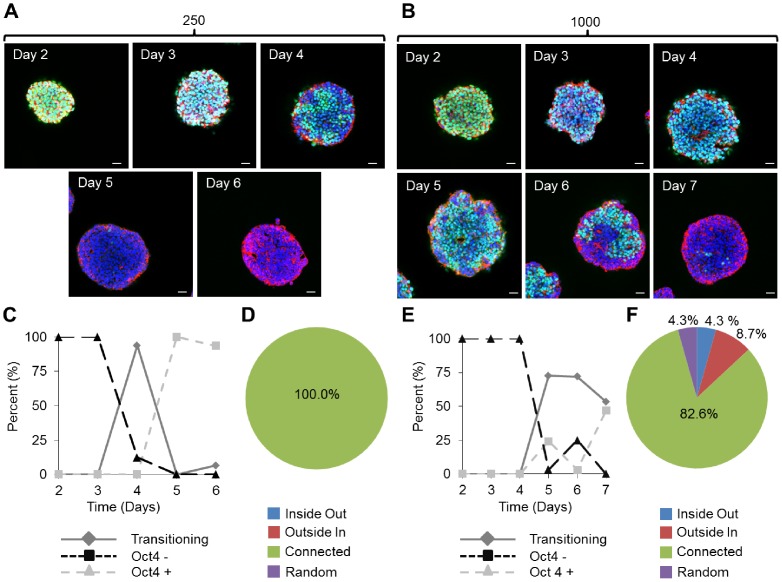
Figure 3. Transition times for differentiation patterns within EBs vary as a function of size.
Confocal images of EBs stained with DAPI (blue), phalloidin (red), and Oct4 (green) shown at a depth of 25 µm for EBs of (A) 250 and (B) 1000 cells. (C, E) Temporal dynamics of observed patterns for 250 cell EBs (C) and 1000 cell EBs (E). (D, F) the overall distribution of observed patterns for 250 cell EBs over 6 days in culture (D) and 1000 cell EBs over 7 days in culture (F). Scale bars on all images are 25 µm.

