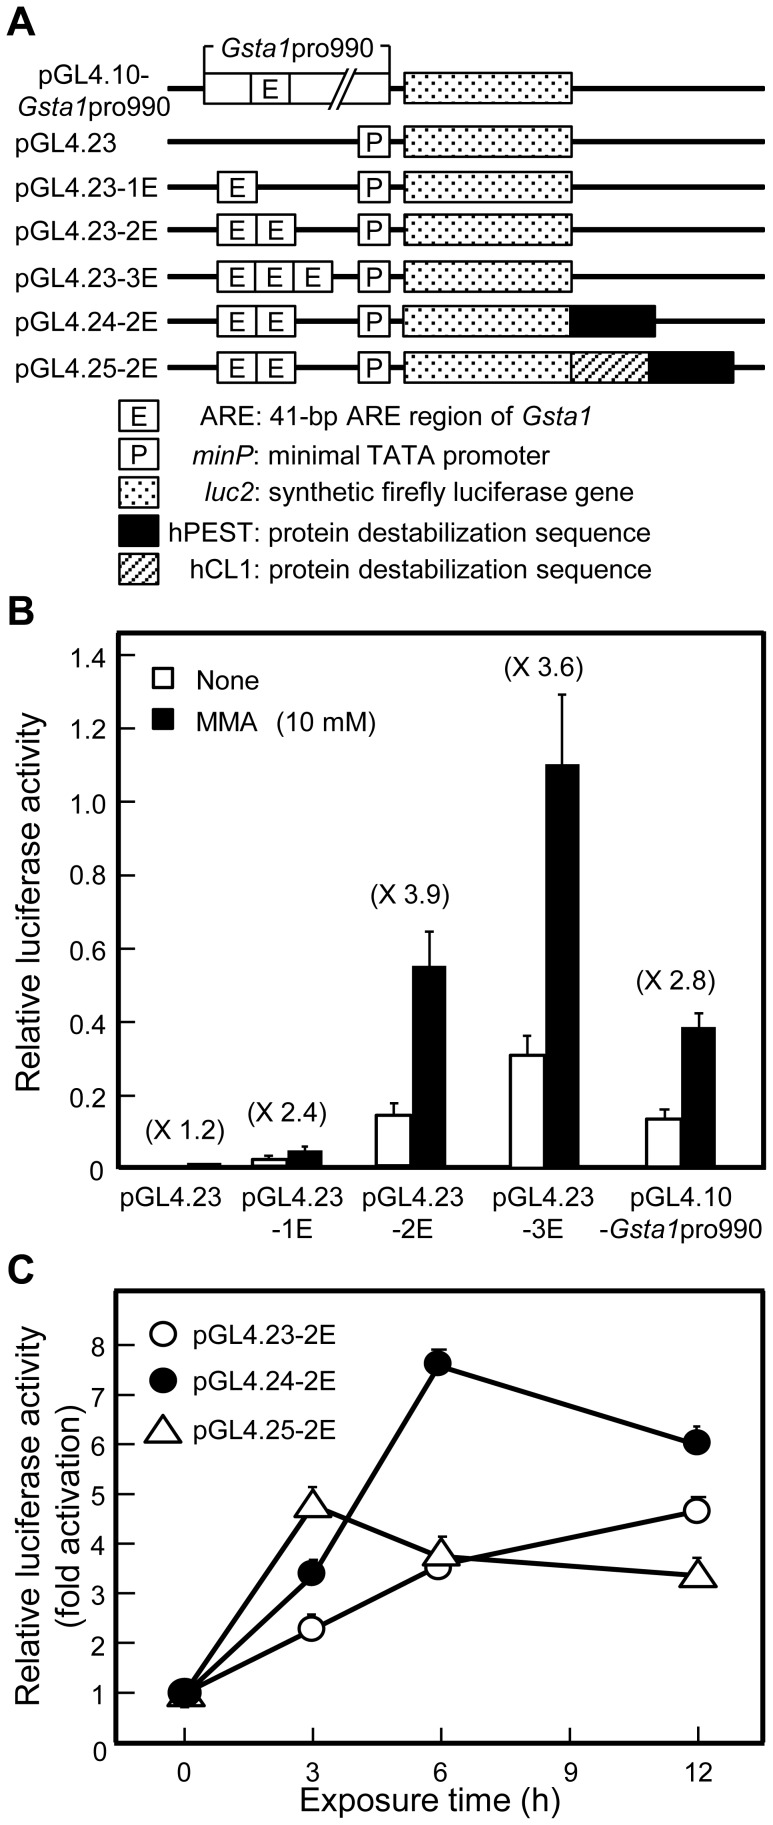
Figure 1. Effect of MMA on luciferase reporter activity in HepG2 cells transfected with vectors containing Gsta1-ARE.
(A) Structures of reporter constructs. The vector pGL4.10-Gsta1pro990 contains 5′-flanking region (-990 to +46; the 41-bp of ARE region is located -729 to -689) immediately upstream of the synthetic firefly luciferase reporter gene (luc2), which was previously constructed [16]. The 41-bp of ARE region contains 2 ARE consensus sequences (see “Materials and Methods”). The vector pGL4.23 is a plasmid with a minimal promoter (minP), which contains a TATA-box promoter element immediately upstream of luc2 and immediately downstream of the multiple cloning sites. The vectors pGL4.23-1E, pGL4.23-2E, and pGL4.23-3E contain 1, 2, and 3 copies, respectively, of the Gsta1-derived ARE upstream of minP. The vectors pGL4.24-2E and pGL4.25-2E contain 2 copies of the Gsta1-ARE and minP (“ARE-ARE-minP unit”) immediately upstream of luc2 with destabilization sequences hPEST and hCL1-hPEST, respectively. (B) Effects of MMA on the promoter activity of minP downstream of the ARE(s). HepG2 cells were co-transfected with phRL-CMV and 1 of the 5 plasmid vectors (pGL4.23, pGL4.23-1E, pGL4.23-2E, pGL4.23-3E, and pGL4.10-GSTa1pro990), cultured for 24 h, incubated without or with MMA (initial concentration, 10 mM) for 6 h, and subjected to the assay for firefly and Renilla luciferase activities. Firefly luciferase activities were normalized to Renilla luciferase activities. Data are presented as the mean ± SD (n = 4–21). (C) Increase in response rate of ARE-reporter activity using the destabilized luciferase gene. Cells were co-transfected with phRL-CMV and 1 of 3 vectors (pGL4.23-2E, pGL4.24-2E, and pGL4.25-2E), cultured for 24 h, incubated with MMA (initial concentration, 10 mM) for the indicated periods, and subjected to the assay for firefly and Renilla luciferase activities. Firefly luciferase activities were normalized to Renilla luciferase activities; for each vector, relative luciferase activities were expressed with the control value, obtained without exposure to MMA (1.342 for pGL4.23-2E, 0.203 for pGL4.24-2E, and 0.026 for pGL4.25-2E; the decrease of basal luciferase activity was dependent on protein destablization sequences), taken as 1.0. Data are shown as the mean ± SD (n = 4–6).

