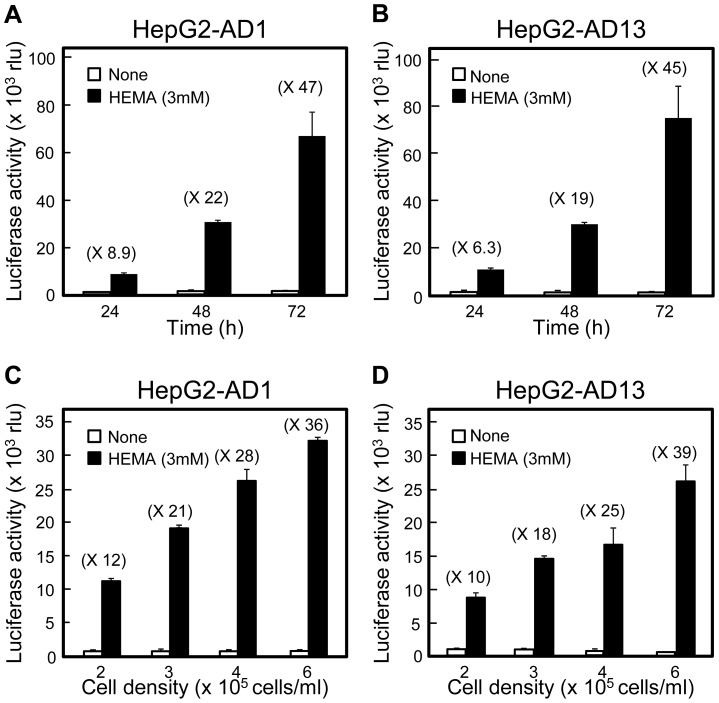
Figure 5. Effect of HepG2-AD1 and HepG2-AD13 cell densities on HEMA-induced ARE activation.
(A, B) Culture time-dependent increase in responsiveness to HEMA in HepG2-AD1 and HepG2-AD13 cells. Stable cells (1 × 10⁵ cells) were seeded in a 24-well plate, cultured for 24, 48, or 72 h, incubated for 6 h without or with HEMA (3 mM), and subjected to the assay for luciferase activities. Data are presented as the mean ± SD (n = 3). (C, D) Cell density-dependent increase in responsiveness to HEMA in HepG2-AD1 and HepG2-AD13 cells. Stable cells (1, 1.5, 2, or 3 × 10⁵ cells) were cultured in a 24-well plate for 24 h, incubated for 6 h without or with HEMA (3 mM), and subjected to the assay for luciferase activities. Data are presented as the mean ± SD (n = 3). rlu, relative light unit.

