
Figure 2. Pairwise SDME (S2) model predicts the firing rate of single cells better than conditionally independent LN (S1) models.
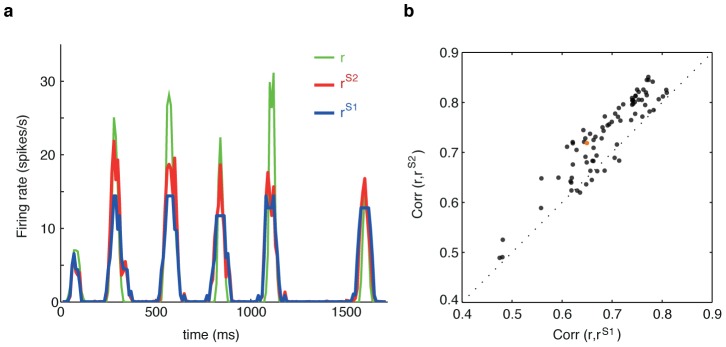
(a) Example of the PSTH segment for one cell (green), the best prediction of the S1 model (blue) and of the S2 model (red). (b) Correlation coefficient between the true PSTH and S2 model prediction (vertical axis) vs. the correlation between the true PSTH and the S1 model prediction (horizontal axis); each plot symbol is a separate cell, dotted line shows equality. S2 significantly outperforms S1 ( , paired two-sided Wilcoxon test). The neuron chosen in panel (a) is shown in orange.