
Figure 3. An overview of maximum entropy encoding models.
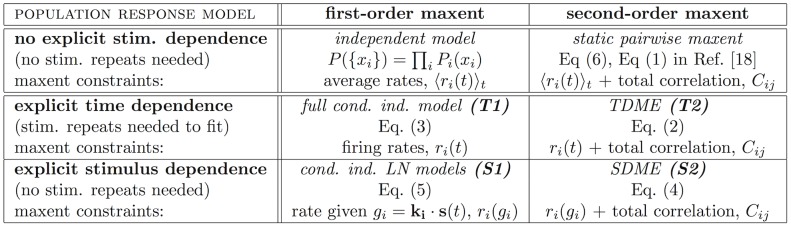
The explicit dependence of single-neuron terms ( , vertical axis, ‘T’ or ‘S’), and the absence or presence of pairwise terms (
 , horizontal axis, ‘1’ or ‘2’), together define the type of the maximum entropy model (e.g. pairwise SDME is ‘S2’). For completeness, the first row of the table includes static maximum entropy models of population vocabulary,
  , which have no explicit stimulus dependence. Full conditionally independent model (T1) reproduces exactly the instantaneous firing rate of every neuron, and thus fully captures the stimulus sensitivity, history effects, and adaptation on a single neuron level; for experimentally recorded rasters with stimulus repeats, simulated T1 rasters are often generated by taking the original data and, at each time point and for every neuron, randomly permuting the responses recorded on different stimulus repeats. “Total correlation” is the pairwise correlation matrix of activities,
 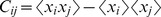 , averaged over all repetitions and all times in the experiment.