
Figure 4. Pairwise SDME (S2) model predicts population activity patterns for  neurons better than conditionally independent LN (S1) models.
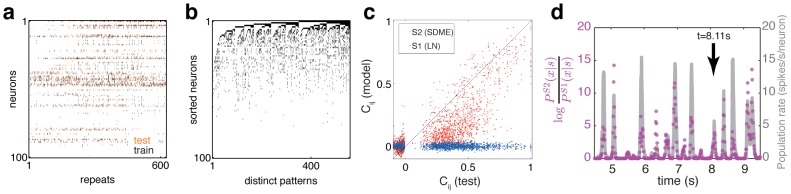
(a) The activity raster for 100 neurons across 626 repeats of the stimulus at a point in time where the retina is moderately active ( ). Dots represent individual spikes; training repeats denoted in black, test repeats in orange. (b) The diversity in retinal responses in a. Shown are all distinct patterns; their number is comparable to the number of repeats. Neurons are resorted by their instantaneous firing rate (high rate = top, low rate = bottom). (c) S2 model fit on the training repeats predicts the reliably estimated correlation coefficients between pairs of neurons at various time points where the retina is active. We identify all correlation coefficients whose value can be estimated from data with less than 25% relative error across many splits of the repeats into two halves. The value of these correlation coefficients is estimated on the test set (horizontal axis) and compared to the model prediction (vertical axis). (d) The log-likelihood ratio of the population firing patterns under the S2 model and under the S1 model, shown as a function of time (violet dots, scale at left) for an example (test) stimulus repeat. For reference, the average population firing rate is shown in grey (scale at right). The arrow denotes the time bin displayed in a, b.