
Figure 5. The performance of the SDME (S2) model relative to conditionally independent LN (S1) models.
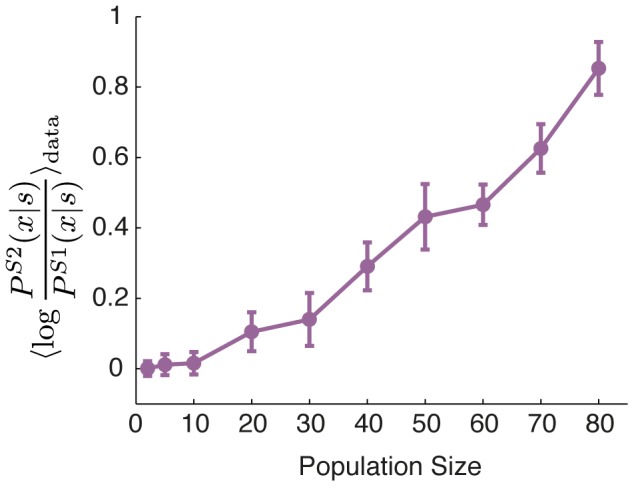
The average log likelihood ratio between the S2 and the S1 models evaluated on the test set, as a function of the population size,  (error bars = std over 10 randomly chosen groups of neurons at that
  ).
).