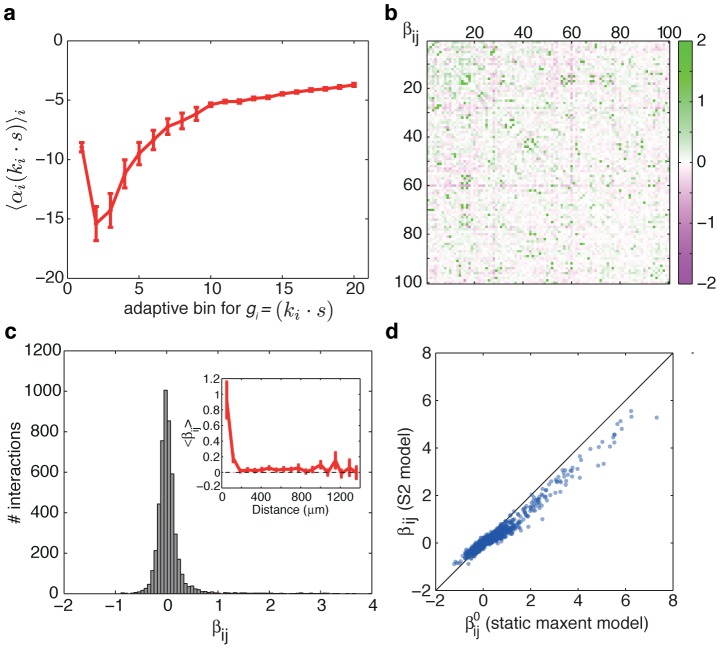
Figure 8. Pairwise SDME (S2) model parameters.
(a) Average values of the LN-like driving term,  , where
  , across all cells
  (error bars = std across cells), for each of the
  adaptive bins for
  (see Methods). (b) Pairwise interaction map
  of the S2 model, between all
  neurons in the experiment. (c) Histogram of pairwise interaction values from (b), and their average value as a function of the distance between cells (inset). (d) For each pair of cells
  and
and  , we plot the value of
  under the static maximum entropy model of Eq. (6) vs. the
  from the S2 model of Eq. (4).

