
Figure 9. Clustering of response patterns into basins of attraction centered on meta-stable patterns generalizes across repeats.
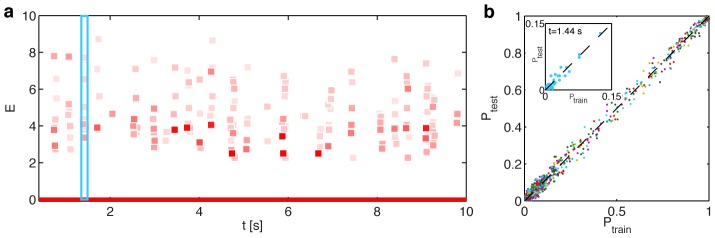
a) Every response pattern  from data is assigned to its corresponding meta-stable pattern
  by descending on the energy landscape
  defined by the S2 model of Eq (4) until the local minimum is reached (see text). Across all test repeats and at each point in time (horizontal axis), we find the metastable states that are visited more than 30 times, plot their energy
  (vertical axis), and the number of repeats on which that metastable state is visited (shade of red). b) Inset: for
  (blue rectangle in a), we plot the frequency of visit to each metastable state (dots) in the training set (horizontal) against the frequency in the test set (vertical). Main panel: the same analysis across all time bins (different colors) superposed, dashed line is equality.