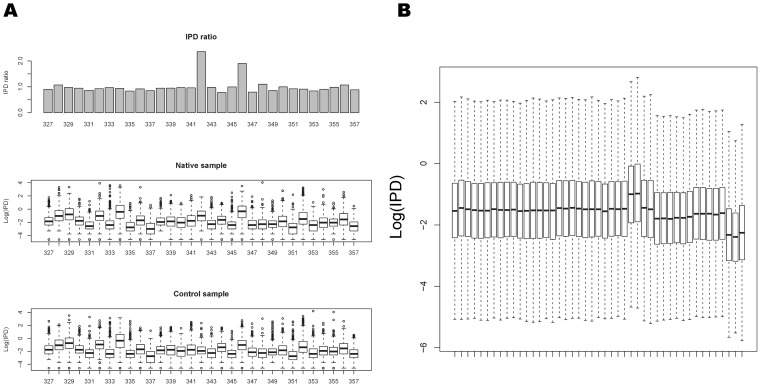
Figure 1. Movie effects and an IPD profile example.
(A) IPD distributions of positions 327–357 in the native and control samples (Plasmid m4C native and Plasmid m4C control in Table 1). The middle and bottom panels show IPD distributions(Boxplot) of the native and control sample respectively. The top panel shows ratio of the average IPD between native sample and control sample. Position 342 is modified, and its ratio of the average IPD values between native sample and control sample is much higher than the other positions. In addition, a single modified nucleotide can affect IPD distributions at several flanking bases. Here, the average IPD of position 346 in the native sample is higher than that of the control sample because of the modification event at position 342. (B) Boxplots of IPD distributions of 45 movies of E. coli WGA-FCR in Table 1 show that the IPD distribution can undergo large overall shifts across different movies.

