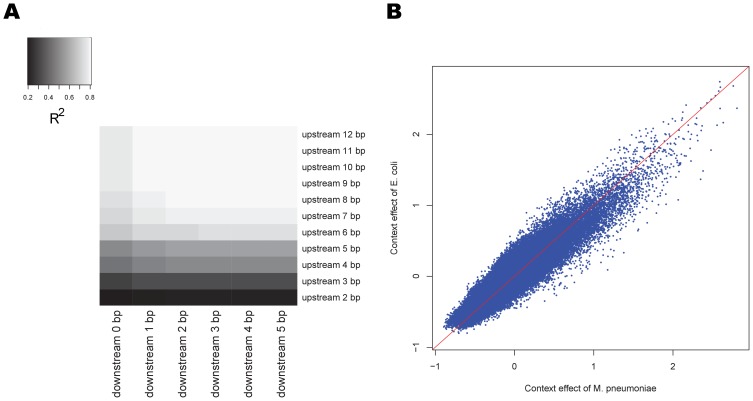
Figure 3. Impact of sequence context on position-specific kinetic rates.
(A) Heatmap of  for the position-specific kinetic rate variance explained by sequence context suggests that 7 bases upstream and 2 bases downstream, [−7,+2], of the incorporation site are the most informative. Bases beyond this region do not provide much information about polymerase kinetics. (B) Scatter plot of the [−7,+2] context effect in whole genome amplified E. coli and M. pneumoniae (E. coli WGA-C and M. pneumoniae WGA-C2 in the Table 1) shows that context effects are highly consistent between these experiments, with a Pearson's correlation coefficient is 0.91.

