
Figure 4. Schematic diagram of the hierarchical model.

The red letter A represents the test base, with each read covering this position contributing an IPD, denoted by 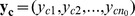 and
and 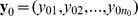 for native and control samples(if available), respectively, where
  and
and  indicate the sequence coverage. IPDs of homologous positions in historical data are denoted by
 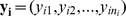 , where
  and
and  is the number of homologous positions.