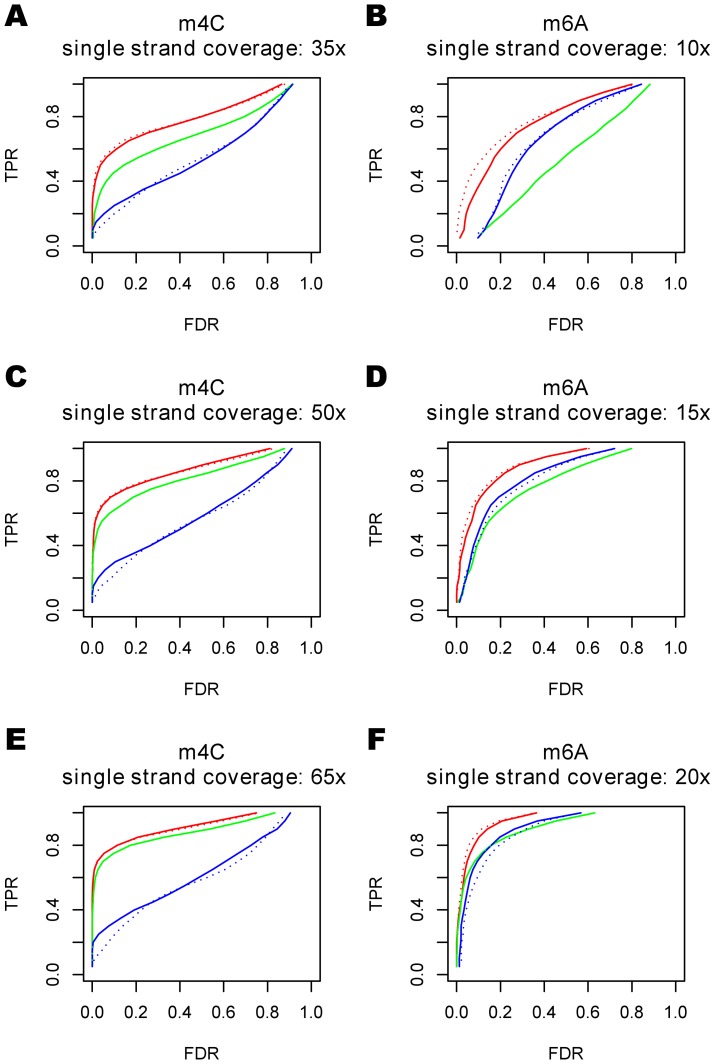
Figure 5. Performance of the hierarchical model in plasmid data.
The red, green and blue curves are ROC curves for the hierarchical model with control data, the case-control method, and the hierarchical model without control data, respectively. These three methods were tested on two different datasets: 1) a 3,589 bases long plasmid with 19 known 4-methylcytosines(4-mC) under single strand coverage 35x,50x,and 65x, respectively(A,C,E), and 2) a 3,591 bases long plasmid with 23 known N6-methyladenines(6-mA) under single strand coverage 15x,20x,25x(B,D,F). The solid lines are ROC curves using a [−6,+1] sequence context and the dotted lines are ROC curves using the [−7,+2] sequence context.

