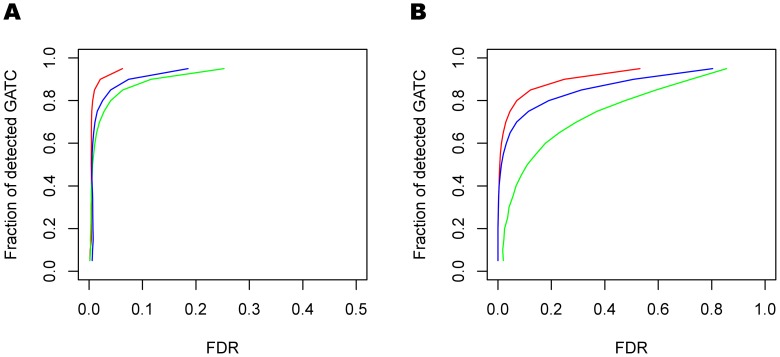
Figure 6. Performance of the hierarchical model in E. coli K-12 data.
The red, green and blue curves are ROC curves for the hierarchical model with control data, the case-control method, and the hierarchical model without control data, respectively. (A) shows the ROC curve when the detection region is restricted to 20 bp around the adenine residue in the GATC context, and (B) shows the ROC curve for the whole genome detection.

