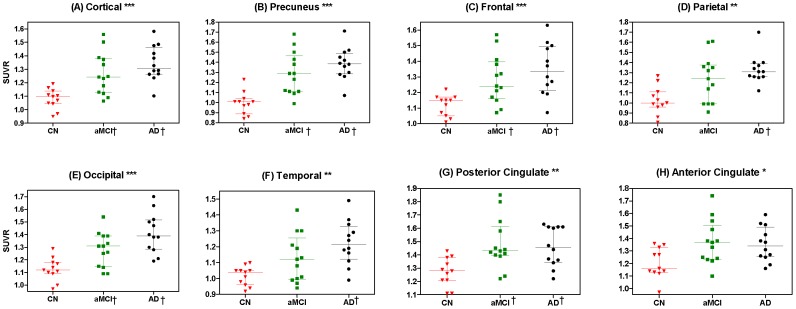
Figure 1. Scatter plots showing general and individual region-to-cerebellum ratios between different groups.
Comparisons of [18F]AV-45 SUVR in the predefined VOIs of the global cortical (A), precuneus (B), frontal (C), parietal (D), occipital (E), temporal (F), posterior cingulate (G) and anterior cingulate (H) areas among the cognitively normal (CN), amnestic mild cognitive impairment (aMCI), and Alzheimer's disease (AD) subjects. (* p<0.05, ** p<0.005, *** p<0.0005, when comparing SUVR among CN, aMCI and AD subjects with the Kruskal–Wallis ANOVA test. † p<0.05 versus CN subjects with Dunn's post hoc analysis).

