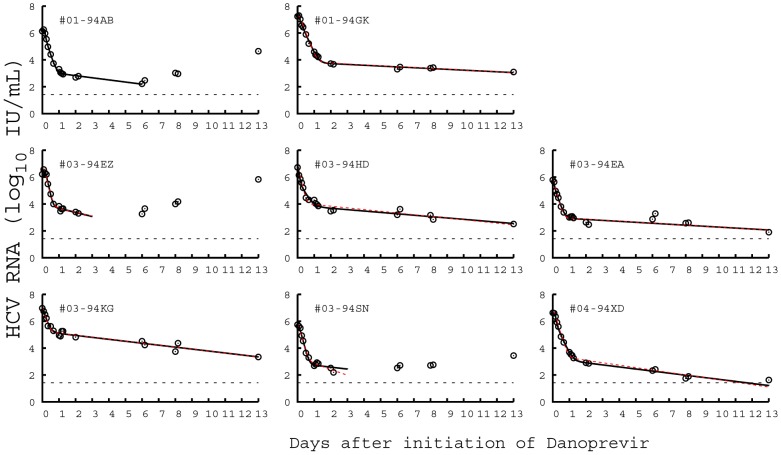
Figure 1. Comparison of viral load data with model predictions for each patient.
The prediction from the standard biphasic model is shown by the red dashed line and the prediction from the long-term approximation of the full multiscale model is shown by the black solid line. In most cases the two predicted viral load decay curves overlap and cannot be distinguished. The parameter values used to generate the theoretical curves are the best fit values given in Table 1 and 2, respectively. Viral rebounds occur due to drug resistance and the decay data (circles) was only fit until resistance was detected or rebound was observed. The limit of viral load detection is indicated by the black dashed line.

